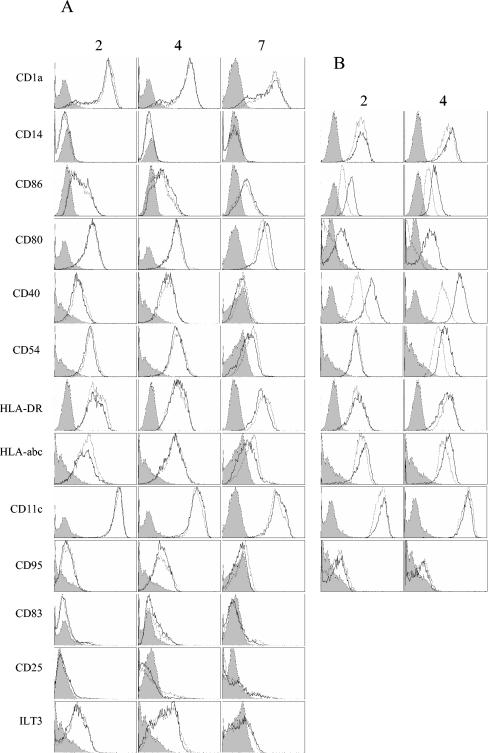
FIG. 2.
Expression of surface molecules on MV-infected MP and DC. The expression of several molecules at the surface of DC (A) and MP (B) was analyzed by flow cytometry 2, 4, and 7 (DC only) days after infection. Control DC or MP are represented by gray lines, and MV-infected cells (MOI = 2) are represented by black lines. Isotype controls are shown as gray histograms. Data are representative of the results from five independent experiments for DC and four independent experiments for MP.

