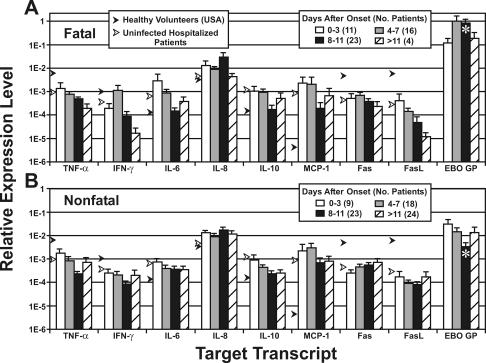
FIG. 3.
Relative expression of cytokines, Fas antigen, FasL, and Ebola-S virus GP. Average values were determined from quantitative PCR (TaqMan) assays performed on samples from 48 patients with fatal disease (A) and 70 patients with nonfatal disease (B). Asterisks indicate statistically significant differences between fatal and nonfatal cases (t < 0.05). Black arrows indicate levels for 25 uninfected patients, and white arrow indicate levels for five healthy volunteers (Special Pathogens Branch workers). The bars on the graph indicate standard errors.

