
Figure 2.
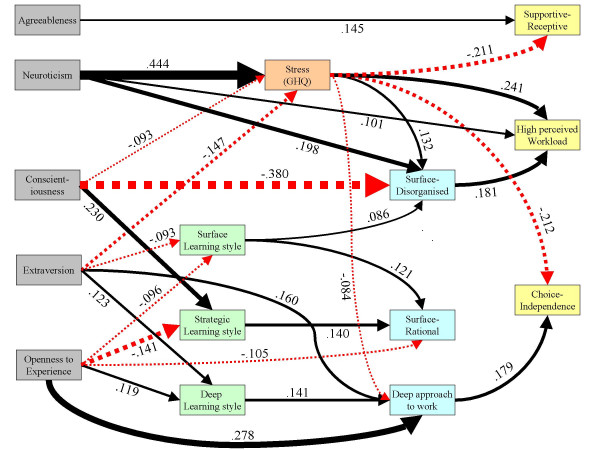
Path diagram showing the relationships among the measures of personality, learning style, stress, approaches to work, and workplace climate. The width of arrows is proportional to the strength of an effect, which is shown alongside each line as a path (beta) coefficient. Negative effects are shown as red, dashed lines. For details of the statistical method and a fuller model incorporating all links, see Supplementary Information.