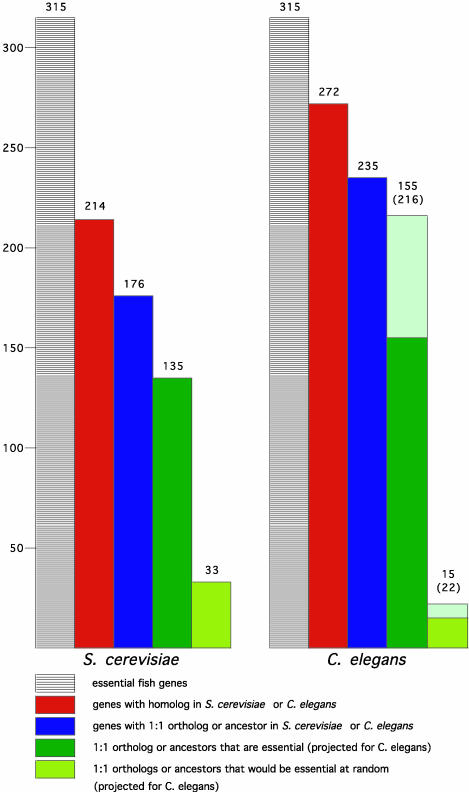
Fig. 4.
Essentialness of genes is evolutionarily conserved. Shown is an analysis of S. cerevisiae (Left) and C. elegans (Right) genes that are homologous to the essential fish genes. In each case, the leftmost columns represent 315 essential fish genes, the red columns show how many of these have homologues in yeast (214) or worm (272), and the blue columns show which have a 1:1 orthologue or “ancestor” gene in yeast (176) or worm (235). The dark green columns represent the number of these yeast or worm orthologues that are essential in their respective species, 135 of the 176 yeast genes, and 155 of the 235 worm genes. The pea green columns show the number that would be predicted to be essential at random, 33 of the 176 yeast genes, and 15 of the 235 worm genes. Thus, the difference between the dark green and pea green columns is the enrichment. In the case of the worm, the pale green extensions to the two green columns represent projections of how many of the orthologues would be found to be essential if 100% of the worm genes had been successfully knocked down by RNAi; this estimate prorates both for the reported failure rate of RNAi and the number of genes for which no RNAi data have been reported. This calculation estimates that 216 of the 235 worm genes are likely to be essential whereas only 22 would be expected to be at random. Note that the percentage of worm orthologues that are essential that is stated in the text does not include the genes for which no RNAi data have been reported.

