Fig. 2.
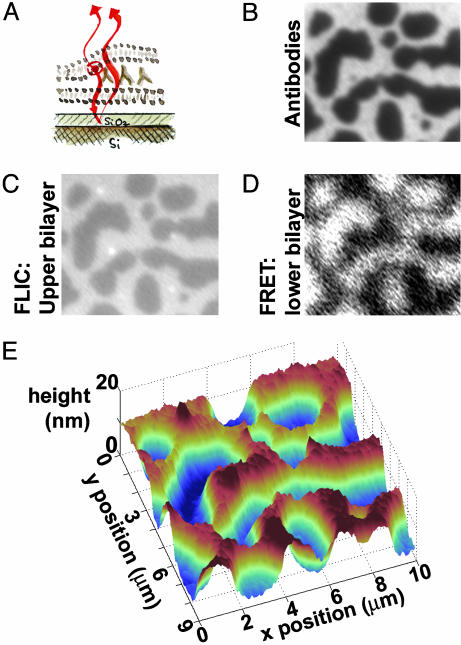
Topographic reconstruction via FLIC microscopy and FRET. (A) Schematic illustration. The supported bilayer sits on a 60-nm SiO2 layer grown on areflective silicon substrate, allowing FLIC; interference between the excitation and emission light of the fluorophores in the upper bilayer with their reflections from the Si surface leads to height-dependent fluorescence intensity. Images B–D are 10 μm wide. (B) Fluorescence image of FITC-labeled antibodies at an intermembrane junction, as in Fig. 1D.(C) Fluorescence image of the Texas red-labeled upper bilayer. Higher intensity corresponds to greater distance from the reflective Si surface. (D) Fluorescence image of the Marina blue-labeled supported bilayer. FRET between the Marina blue donors and the Texas red and FITC acceptors diminishes the blue fluorescence, with the protein/bilayer FRET dominating. Hence, areas of sparse antibodies, where there is no FITC/Marina blue FRET, appear brighter than dense areas. (E) Topographic reconstruction from the FLIC data of C, showing the upper bilayer patch draped over hills and valleys of antibodies ≈14 nm in height. The system is in an aqueous solution of 10 mM NaCl.

