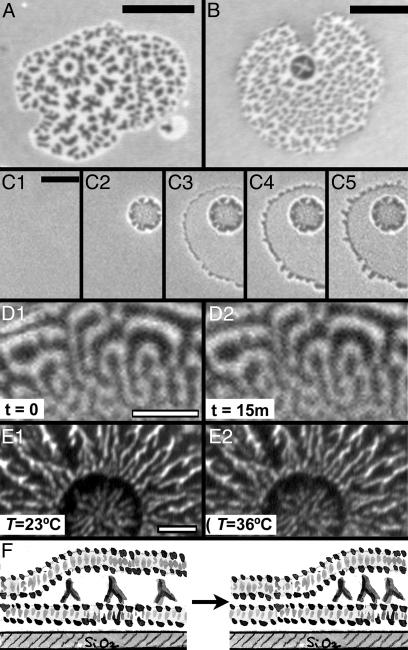
Fig. 4.
Dynamics of intermembrane protein patterns. Images A–E are fluorescence images of FITC-labeled antibodies. (A and B) Patterns that include a nearly radially symmetric feature. (Bar = 10 μm.) (C) Images taken during the formation of an intermembrane junction. Initially (C1, time t = 0), the antibodies are uniformly distributed along the supported bilayer. A giant vesicle approaches, redistributing the proteins at a circular contact zone (C2, t = 0.44 s); the vesicle then ruptures, forming a larger intermembrane junction (C3, t = 0.88 s). At the junction edges, fingering of the spreading upper bilayer patch pushes antibodies outward (C3, t = 0.88 s; C4, t = 1.32 s); the spreading slows and soon stops (C5, t = 7.48 s). Fine patterns in the junction area are not visible at the low resolution and short exposure times at which this sequence was taken. (Bar = 5 μm.) (D) After their formation, the protein distribution is static and does not coarsen with time; shown are images of the same region, separated in time by 15 min. (Bar = 3 μm.) (E) Heating the intermembrane junctions from room temperature (23°C) to 40°C leaves the protein patterns unaffected; shown are images of the same junction, formed at 23°C, taken at 23°C and 36°C. (F) Schematic illustration: the strong bilayer-bilayer adhesion energy pushes antibodies into dense zones to maximize the area of tight bilayer-bilayer contact.

