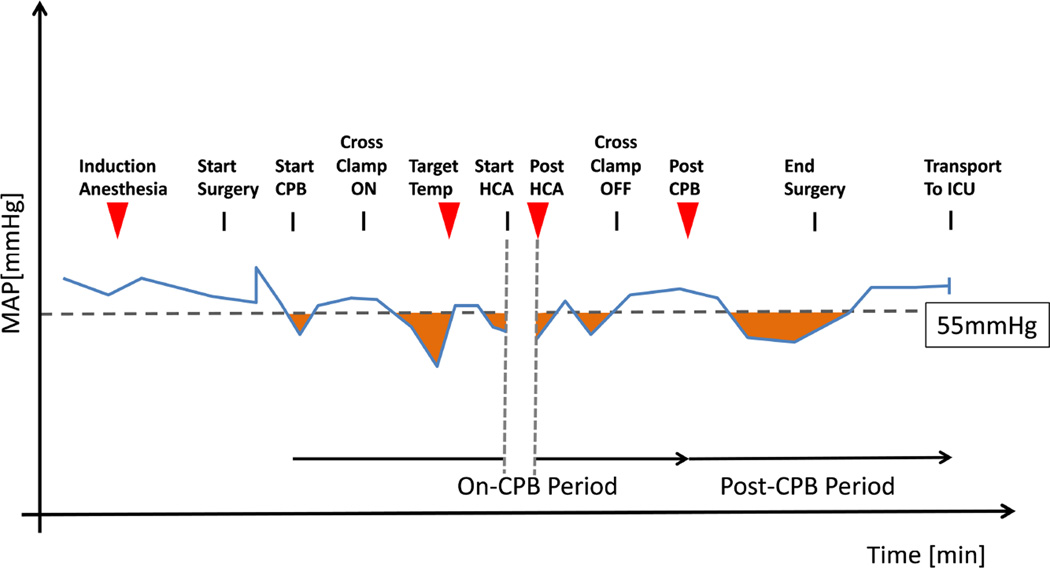
Figure 1. Sample draw time-points and hemodynamic quantitation strategy.
Relevant time-points (red triangles denote blood-draw) are graphed vs time against an idealized MAP tracing (blue line). A cutoff of 55 mmHg was chosen and the area (in minutes * mmHg) underneath the cutoff was calculated (orange shaded areas). Cumulative values were then determined for an on-CPB period (excluding HCA period) and a post-CPB period. CPB: cardiopulmonary bypass; HCA: hypothermic circulatory arrest; ICU: intensive care unit; MAP: mean arterial pressure.

