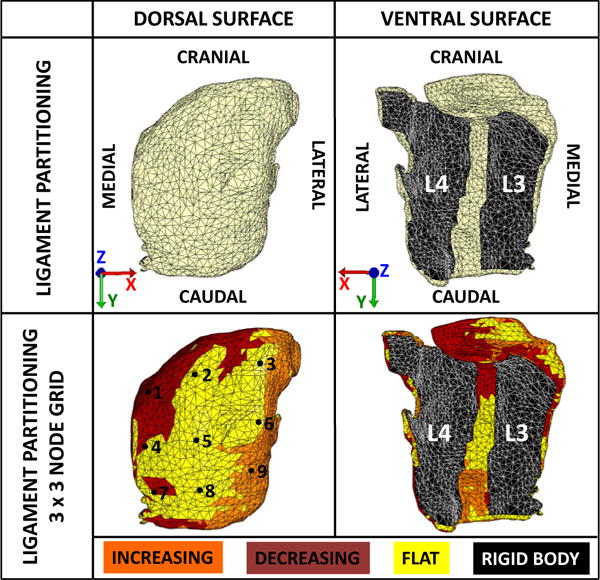
Fig. 4.

Partitioning the finite element mesh. (Top) The mesh was partitioned to reflect the attachments of the superior (L3) and inferior (L4) articular facets. The ligament was defined by an eight-parameter hyperelastic strain energy density function and the articular facets were defined by rigid bodies. Boundary conditions obtained from the subject-specific fluoroscopic data were applied to the model based on the global coordinate axes. (Bottom) The strain energy density function that defined the ligament region was warped to the curvature of the FE model based on the z-component (nz) of the normal vectors of each surface element. The ligament partition was further divided into three regions, which are flat (nz=0.079), increasing (nz=0.57), and decreasing (nz=−0.61) curvatures, where nz=0 would describe a planar surface. A 3×3 grid of nodes was selected on the posterior surface of the FE model to quantify regional ligament deformations.
