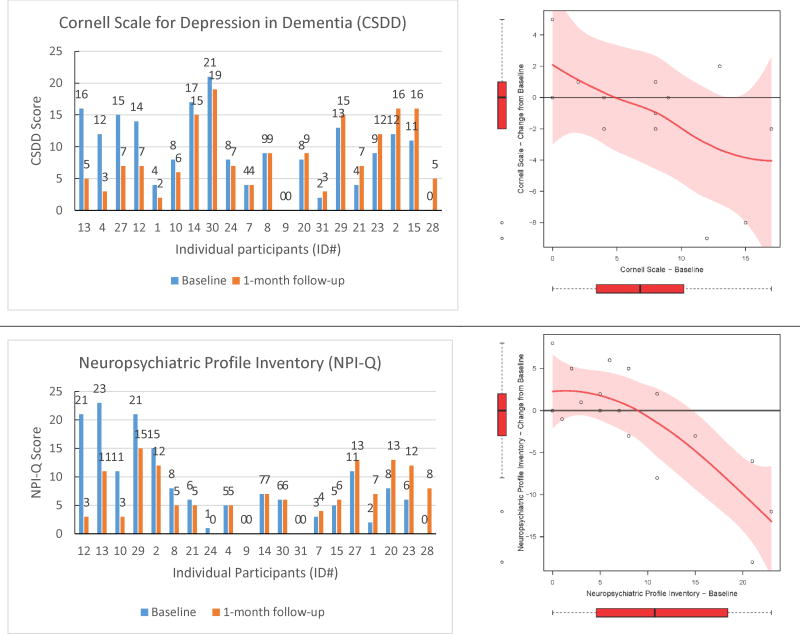
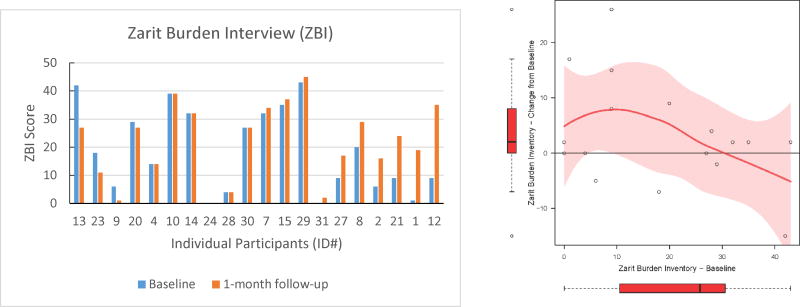
Figure 2.
Individual data for each pre- and post-intervention outcome measure. The left panels show pre-and post-scores for each individual arranged from greatest to least improved participant. The right panels show the change score from pre- to post-intervention as a function of baseline score. The change score figure was restricted to participants who had no missing data on the pre- or post-intervention questionnaires (CSDD: n=13; NPI-Q: n=18; ZBI: n=17). The data trends are shown with lowess curves and 95% confidence interval shading. Box plots reflect the variability of change scores and baseline scores in the sample.


