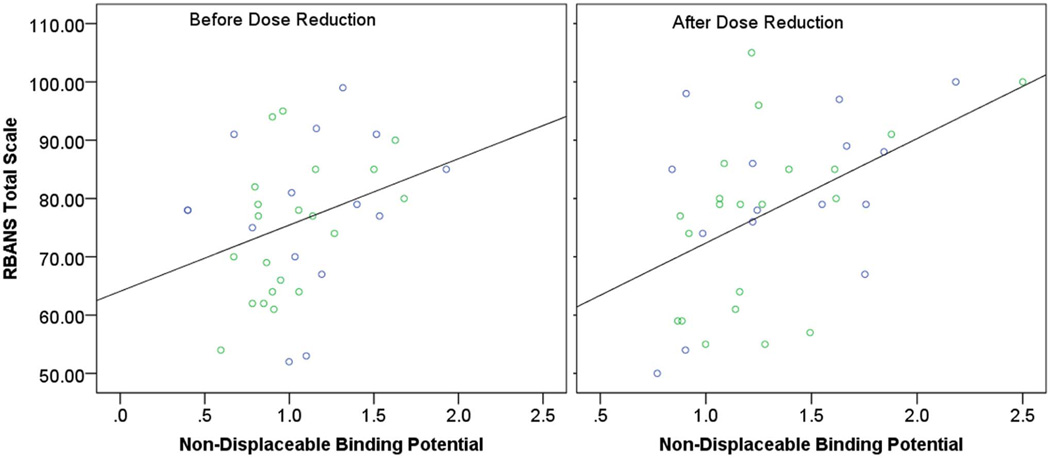
Figure 2. RBANS Total Scale and Whole Striatum non-displaceable Binding Potential.
Left panel: Before Antipsychotic Dose Reduction. R2 = 0.10, p = 0.054. Right panel: After Antipsychotic Dose Reduction. R2 = 0.24, p = 0.002. Green circles represent participants on olanzapine. Blue circles represent participants on risperidone.

