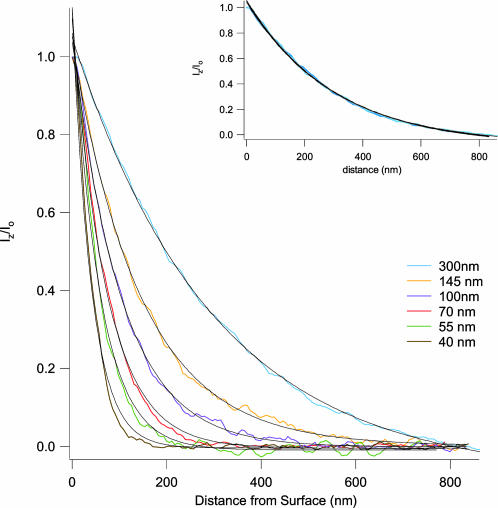
Fig. 2.
Fluorescent measurements of evanescent wave intensities reveal single exponential decays that are stable over time. The penetration depth (dp) is determined by the angle of incidence (θ) of the reflecting laser beam (Eq. 2). Starting from just beyond the critical angle, θ was increased five times, resulting in decreasing values of dp. At each new angle, the fluorescence intensity vs. distance curve was measured and then fitted with a single exponential decay function (Eq. 1; see text): blue trace, dp = 300 nm, θ = 48.7°; orange trace, dp = 145 nm, θ = 49.7°; purple trace, dp = 100 nm, θ = 51.1°; red trace, dp = 70 nm, θ = 53.9°; green trace, dp = 55 nm, θ = 57.8°; brown trace, dp = 40 nm, θ = 66.5°. (Inset) Repeated measurements of an evanescent field are highly reproducible over time. An evanescent wave was maintained for 2 h and measured at the times t = 0, 60, and 120 min. The black lines represent single exponential decay fits of the data corresponding to dp = 300 nm (t = 0 min), dp = 299 nm (t = 60 min), and dp = 302 nm (t = 120 min). Fluorescence was recorded with an exposure time of 10 ms for all measurements.

