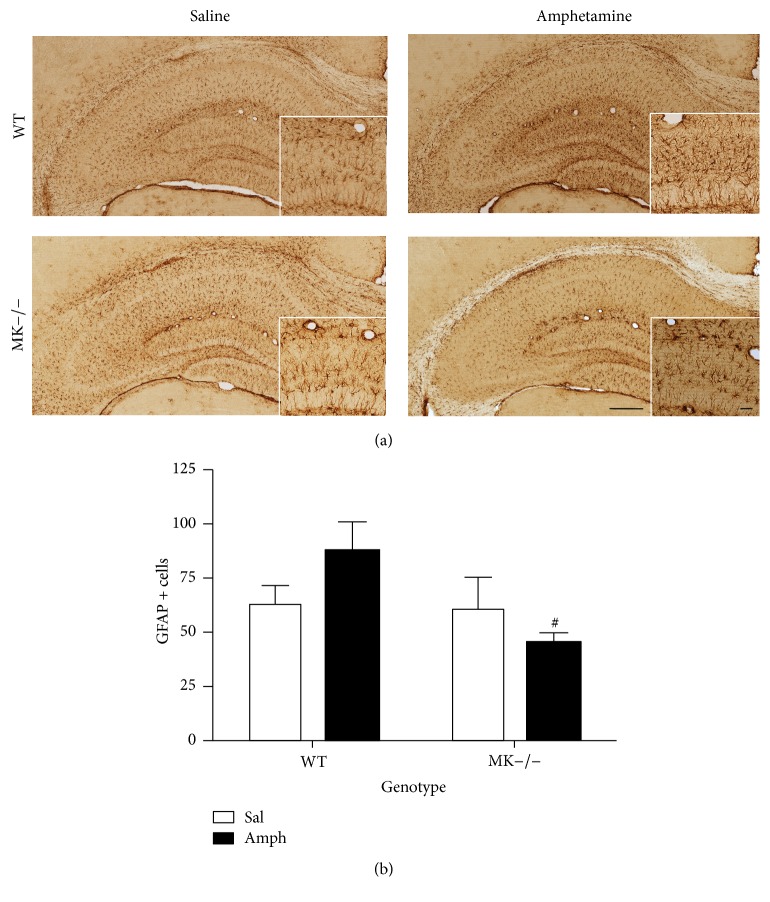
Figure 3.
Amphetamine-induced astrocytosis in the hippocampus of WT and MK−/− mice. (a) Photomicrographs are from GFAP-immunostained hippocampal sections of saline- (Sal-) or amphetamine- (Amph-) treated animals. (b) The graph represents quantification of data (mean ± SEM) obtained from the counts of GFAP-positive cells in standardized areas of the CA1 region of hippocampus. A significant effect of the genotype (F (1,12) = 4.88, P = 0.04) was found. # P < 0.05 versus WT. Scale bar = 200 μm. Magnified inset = 50 μm.

