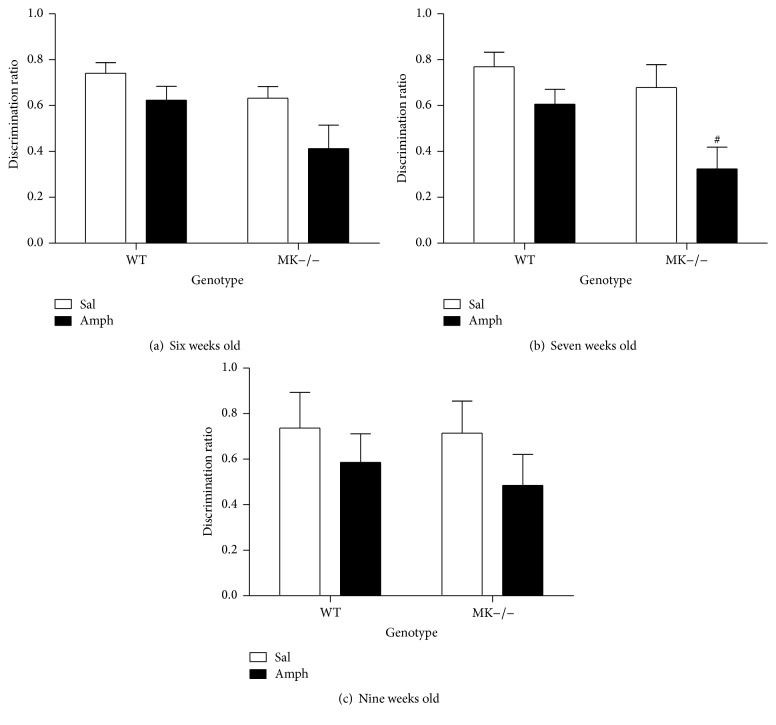
Figure 6.
Behavioral performance in the Y-maze of WT and MK−/− mice treated with amphetamine during adolescence. (a) Figure shows mean ± SEM of discrimination ratio for 6-week-old WT and MK−/− mice pretreated with amphetamine during adolescence. Significant effects of the genotype (F (1,44) = 5.04, P = 0.03) and the treatment (F (1,44) = 6.03, P = 0.02) were found. (b) Figure shows mean ± SEM of discrimination ratio for 7-week-old WT and MK−/− mice pretreated with amphetamine. Significant effects of the genotype (F (1,44) = 5.1, P = 0.03) and treatment (F (1,44) = 10.46, P = 0.002) were found. (c) Figure shows mean ± SEM of discrimination ratio for 9-week-old WT and MK−/− mice pretreated with amphetamine. # P < 0.05 versus WT.

