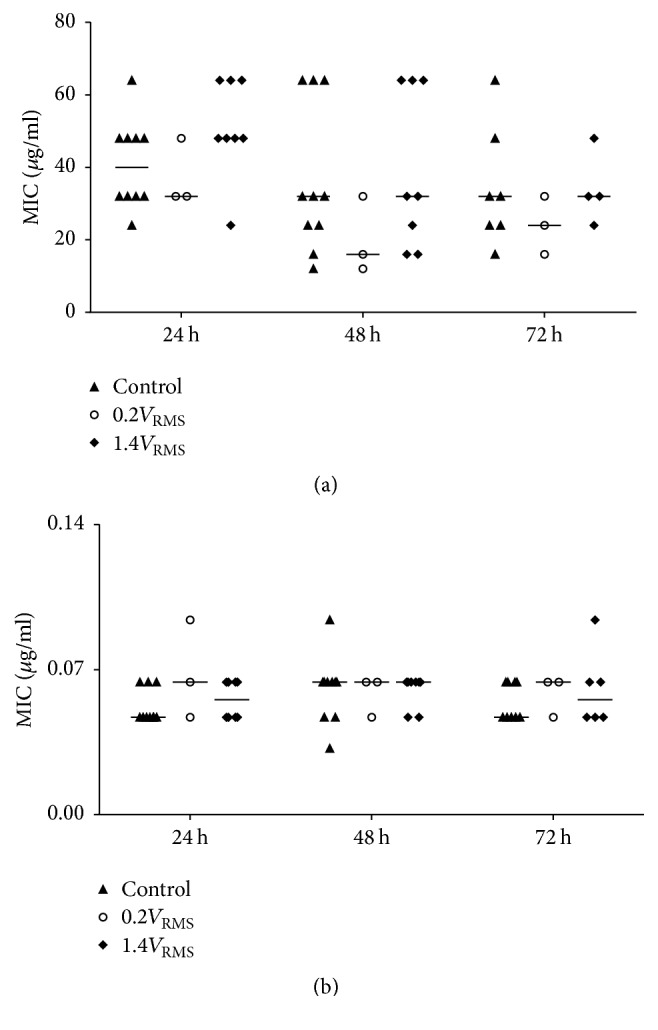
Figure 11.

Determined minimal inhibitory concentrations (MIC) of gentamicin (a) and levofloxacin (b) using E-Test stripes with samples of the supernatants of controls and with 0.2V RMS and 1.4V RMS treated samples over 72 h. Values are presented as median and single values. n ≥ 3.
