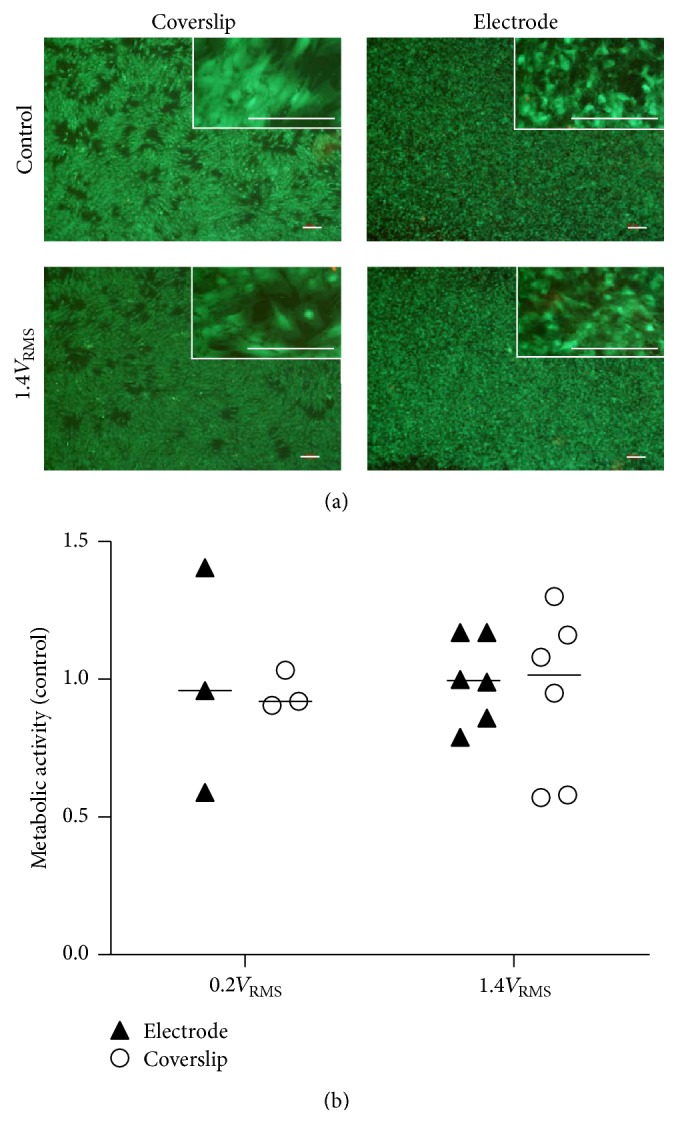
Figure 5.

(a) Live/dead staining of human osteoblasts on coverslips and titanium electrode after three days of electrical stimulation with 1.4V RMS and under control conditions. Live cells display green fluorescence. Dead cells appear red. White bars represent 100 µm. (b) Metabolic activity of human osteoblasts on titanium electrode and coverslips after three days of electrical stimulation with 0.2V RMS or 1.4V RMS compared to controls. Values are presented as median and single values. n ≥ 3.
