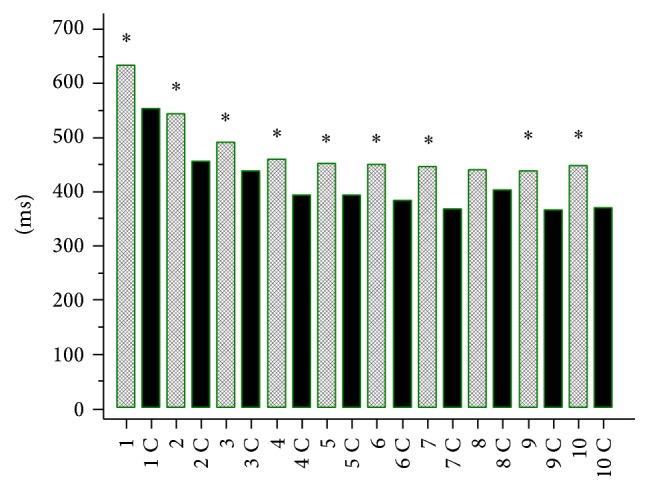
Figure 1.

Simple reaction time (SRT) in lung cancer patients at baseline and in healthy controls (C). 1: 250 ms, 1 C: 250 ms control, 2: 500 ms, 2 C: 500 ms control, 3: 750 ms, 3 C: 750 ms control, 4: 1000 ms, 4 C: 1000 ms control, 5: 1250 ms, 5 C: 1250 ms control, 6: 1500 ms, 6 C: 1500 ms control, 7: 1750 ms, 7 C: 1750 ms control, 8: 2000 ms, 8 C: 2000 ms control, 9: 2250 ms, 9 C: 2250 ms control, 10: 2500 ms, and 10 C: 2500 ms control. The times [ms] indicate delay (250 to 2500 ms) after the previous response in SRT test. ∗ P < 0.05.
