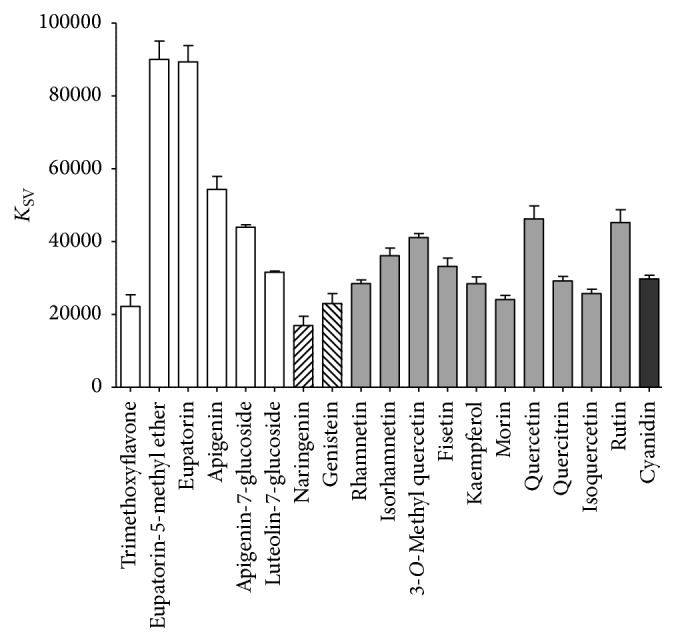
Figure 4.

Estimated K SV values of all tested flavonoids obtained by fluorescence quenching analysis of reduced PDIA3 [0.5 × 10⁻⁶ M] in presence of increasing concentration of flavonoids (up to 2 × 10⁻⁵ M). Data are reported as mean and standard deviation of at least three independent experiments.
