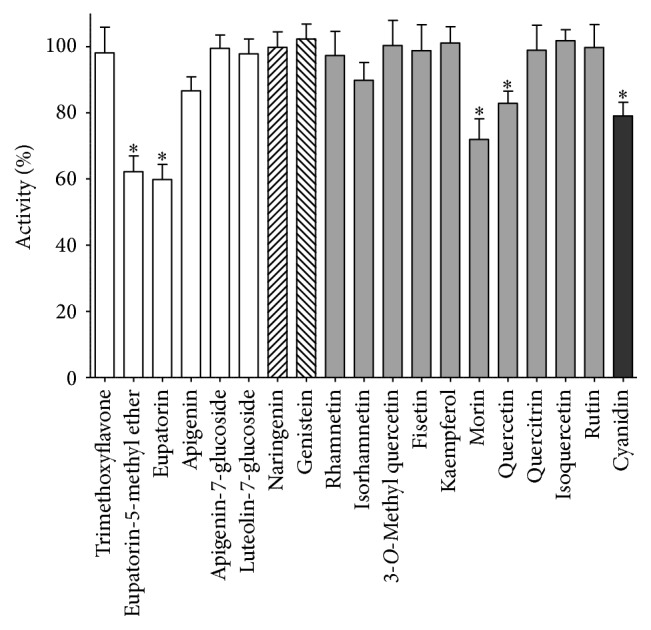
Figure 7.

Comparison of flavonoid effect (at 20 μM concentration) on PDIA3 reductase activity. Plots are displayed as mean and standard deviations of at least six independent measurements. Data were analyzed by Dunnett's test comparing PDIA3 activity in presence of each flavonoid with the activity of untreated protein. Significant differences (p < 0.01) are marked with asterisks.
