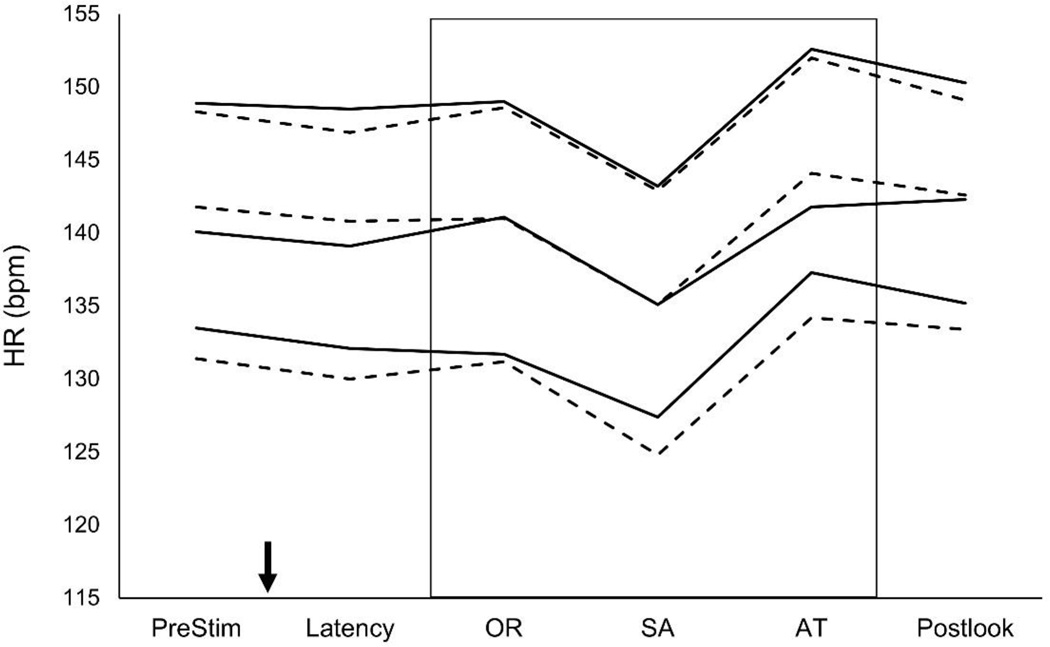
Figure 1.
Infant HR during the various phases of habituation trials analyzed with mixed models. For ease of exposition, values are collapsed across multiple looks during the habituation session. Although the graph shows the well-documented and highly robust changes in HR with age over the first year and the deceleration seen during infant looking while in SA, there are no differences between Supplemented (solid line) and Placebo (dashed line) groups at any point during the trial. The top pair of solid/dashed lines are data from 4 month-olds, the middle pair are from 6-month-olds, and the bottom pair are from 9-month-olds. The downward-pointing arrow represents the onset of the stimulus; the box represents encapsulates the period during which infants were looking at the stimulus. HR = heart rate, SA = sustained attention, PreStim = prestimulus period (before onset of stimulus), OR = orienting, AT = attention termination, Postlook = postlook period (after look is terminated but before withdrawal of stimulus). Data points represent successfully completed habituation sessions where HR data could be successfully coded: n=159 (n=72 and n=87 placebo and supplemented, respectively) at 4 months, n=172 (n=71 and n=101) at 6 months, and n=156 (n=68 and n=88) at 9 mo.

