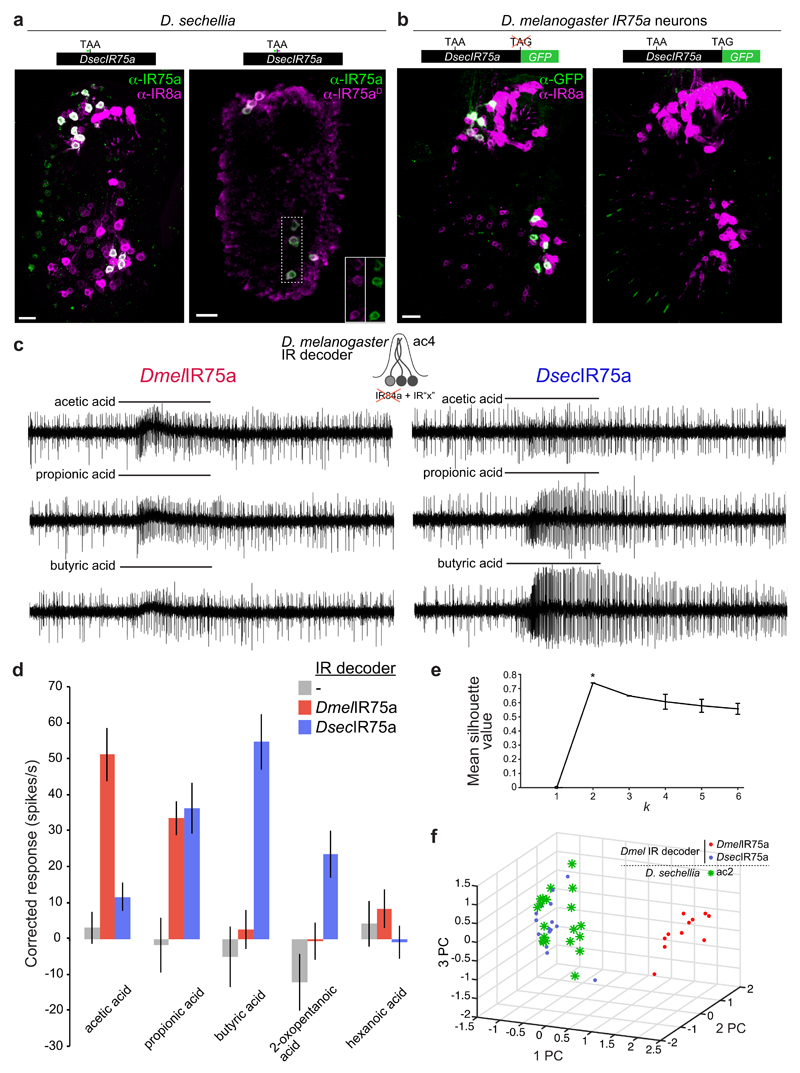
Fig. 2. Translational readthrough of the premature termination codon in D. sechellia Ir75a permits production of a functional olfactory receptor.
a, Immunofluorescence on D. sechellia antennae with anti-IR75a (green, recognising an epitope upstream of the PTC) and IR8a (magenta) (left) or anti-IR75a (green) and anti-IR75aD (magenta, recognising an epitope downstream of the PTC) (right). The insets show the separate channels for anti-IR75a and anti-IR75aD corresponding to the area demarcated with a dashed box. Scale bars = 10 µm.
b, Immunofluorescence with anti-GFP antibodies (green) and anti-IR8a (magenta) on a D. melanogaster antenna in which Ir75a neurons express transgenes encoding DsecIR75a:GFP (UAS-DsecIr75a:GFP/+;Ir75a-Gal4/+) (left) or DsecIR75aSTOP:GFP (UAS-DsecIr75aSTOP:GFP/+;Ir75a-Gal4/+) (right).
c, Representative traces of extracellular recordings of neuronal responses to the indicated stimuli in IR decoder neurons expressing DmelIR75a (UAS-DmelIr75a;Ir84aGal4) or DsecIR75a (UAS-DsecIr75a;Ir84aGal4).
d, Quantification of odour-evoked responses in empty IR decoder neurons (Ir84aGal4, n=5), or the decoder neurons expressing DmelIR75a (n=7-11) or DsecIR75a (n=7-14) (genotypes as in (c)) (mean±SEM; mixed genders).
e, k-means cluster analysis of the responses of DmelIR75a in the IR decoder, DsecIR75a in the IR decoder, and D. sechellia ac2 sensilla to the four main agonists (acetic acid, propionic acid, butyric acid, and 2-oxopentanoic acid). Mean silhouette value and standard deviation of all the solutions within each k value (n=100). The peak silhouette value at k = 2 was significantly different from other k values, indicating that responses of these three distinct neuron classes statistically fall within two clusters.
f, Plot of the three first principal components (PC) from a Principle Component Analysis of the same odour response profiles as in (e).

