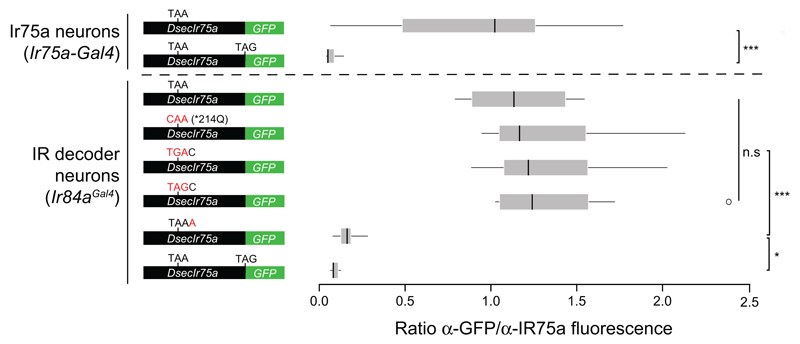
Extended Data Fig. 1. Quantification of efficiency and tissue-specificity of translational readthrough of the D. sechellia Ir75a PTC.
Quantification of GFP staining in the cell bodies of neurons expressing different readthrough reporter constructs in different populations of OSNs (see Fig. 2-3 for genotypes). GFP fluorescence levels were normalised by anti-IR75a fluorescent levels in the Cy3 channel within each analysed cell. Boxplots indicate the median and first and third quartile of the data. Asterisks indicate significance (* p <0.05, *** p <0.0005, n.s. p>0.05) (all pair-wise Wilcoxon-sum-rank-test, Benjamini & Hochberg correction).

