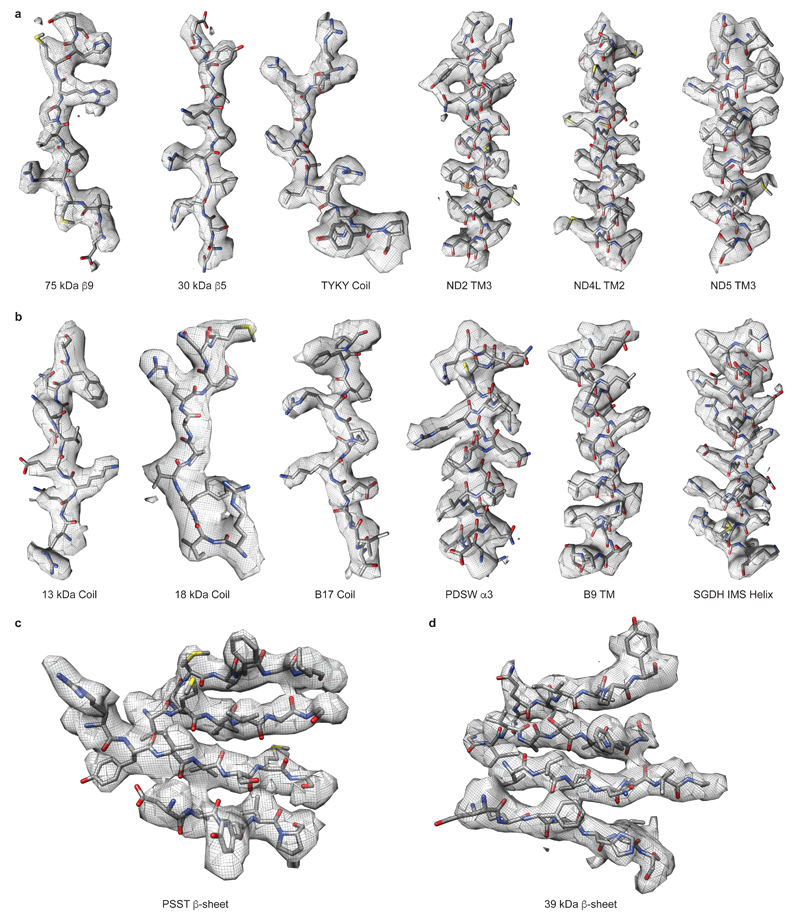
Extended Data Figure 4. Examples of cryo-EM density.
Coils and α-helices from a. core and b. supernumerary subunits. Example β-sheets from c. core PSST subunit and d. supernumerary 39 kDa subunit. Cryo-EM density is shown with the model represented as sticks and coloured by atom with carbon grey, oxygen red, nitrogen blue and sulphur yellow.

