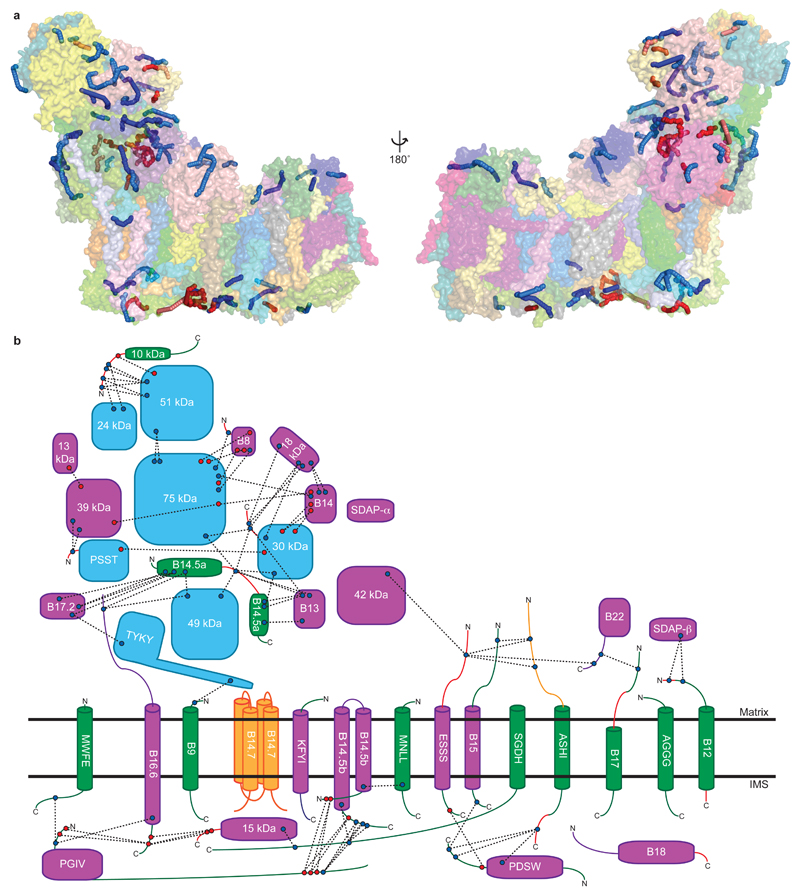
Extended Data Figure 5. Identified cross-links.
a. Solvent accessible surface (SAS) representation of cross-links. Surfaces for complex I subunits are shown transparent and coloured as in Fig. 1. Shortest (SAS) paths calculated using Xwalk55 are shown for cross-links as coloured worms with inter-subunit lysine reactive cross-links in blue, inter-subunit acid reactive cross-links in red, intra-subunit lysine reactive cross-links in light blue, intra-subunit acid reactive cross-links in light red. b. Inter-subunit cross-link schematic. Complex I subunits are shown in a similar orientation as in a. left panel with core subunits cyan, previously assigned supernumerary subunits in magenta, newly assigned or newly built regions of supernumerary subunits in green, poly-alanine regions in orange and unmodelled regions in red. Observed cross-links are indicated by dashed black lines between either blue circles (lysine reactive cross-links) or red circles (acid reactive cross-links). No cross-links were observed to the core subunits of the membrane arm and hence they were omitted for clarity. The horizontal black lines indicate the approximate boundaries of the IMM. Subunits B14.7, B15 and ASHI are shown as being behind the membrane boundaries as they are found on the opposite (far) side of the membrane arm.

