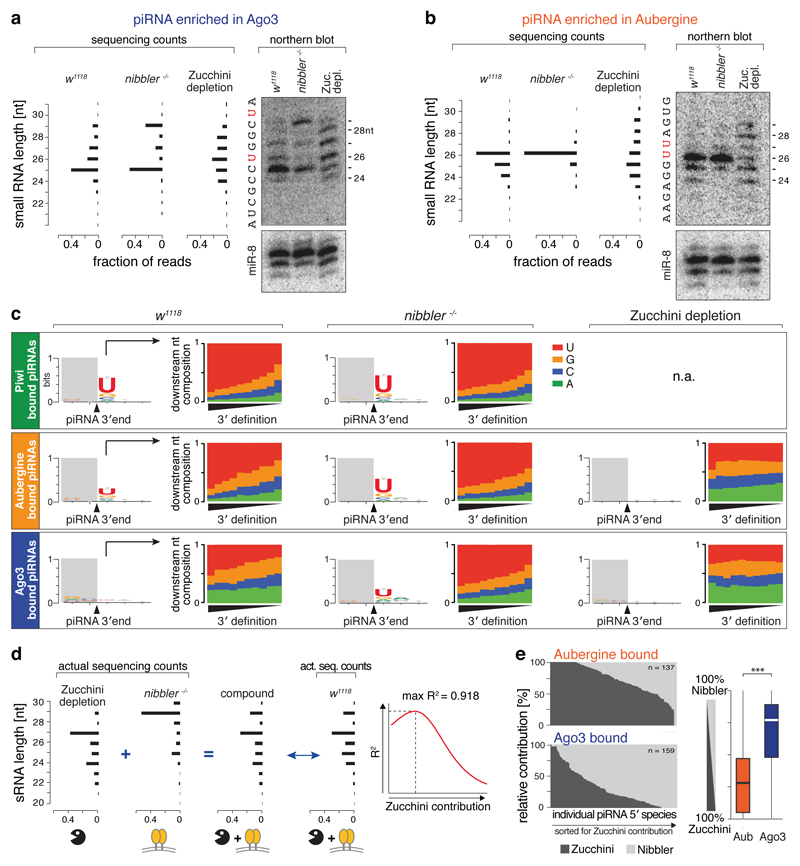
Figure 2. Two genetically independent pathways generate piRNA 3' ends.
a, b) Northern blot analysis (loading control: miR-8) and sequencing counts for an Ago3- (a) or an Aub- (b) enriched piRNAs in indicated genetic backgrounds. Bar charts display fraction of reads with indicated length. Respective RNA sequences are shown.
c) Sequence logos display nucleotide bias around dominant 3' ends of Piwi/Aub/Ago3-bound piRNAs isolated from ovaries of indicated genetic background. Bar plots display the nucleotide composition at the position following dominant 3' ends (piRNAs are split into 10 equally sized bins sorted for their precision index).
d) Shown is how the Nibbler/Zucchini contribution to 3' end formation of individual piRNA 5' species was determined.
e) Shown are the Zucchini/Nibbler contributions for 3' end formation for Aub- and Ago3-bound piRNAs (left: as stacked bar diagram; right: as boxplot; Tukey definition; *** p < 0.001 after Wilcoxon rank-sum test).

