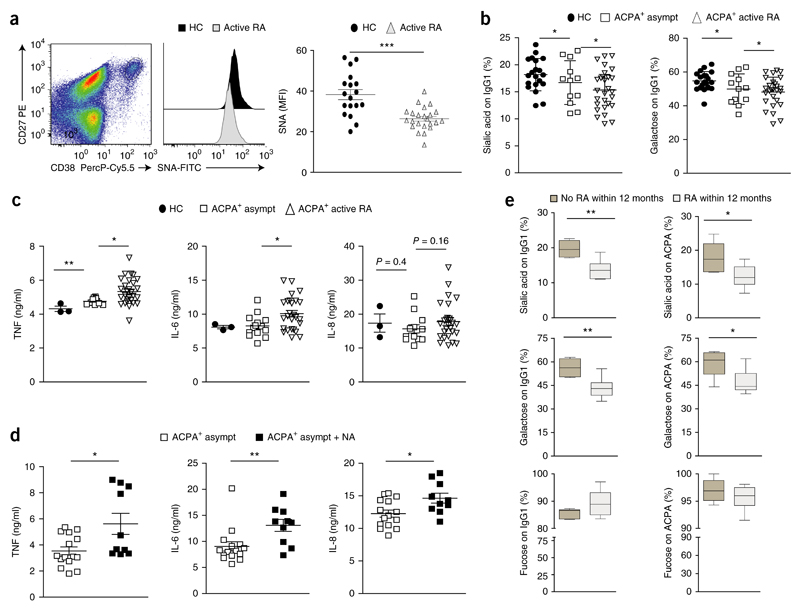
Figure 6. A decrease in plasmablast sialyltransferse activity and IgG sialylation parallels the clinical onset of RA.
(a) SNA-lectin-based quantification of surface sialic acid on CD27hiCD38hiCD19+ plasmablasts from healthy control subjects (HC) (n = 18) and patients with active RA (n = 23) (middle and right). Left, gating of blood plasmablasts (pregated on CD19+ cells); outlined area indicates CD27+CD38+ cells. (b) Mass-spectrometry-based analysis of the sialic acid and galactose content at Asn297 of total IgG from healthy control subjects (HC), asymptomatic ACPA+ subjects that had not yet developed RA (ACPA+ asympt) or ACPA+ patients with active RA (ACPA+ active RA). (c) ELISA of cytokines TNF, IL-6 and IL-8 in supernatants of in vitro–generated monocyte-derived dendritic cells (from healthy human donors) incubated for 14 h with heat-aggregated IgG ICs generated from donors as in b (key). (d) ELISA of cytokines (as in c) in supernatants of in vitro–generated human monocyte-derived dendritic cells incubated with heat-aggregated ICs from asymptomatic ACPA+ subjects, assessed before (ACPA+ asymp) and after (ACPA+ asymp + NA) the neuraminidase-mediated removal of sialic acid (P ≤ 0.02). (e) Sialylation, galactosylation and fucosylation at Asn297 of total IgG1 (on IgG1) and ACPA-specific IgG1 (on ACPA) from asymptomatic ACPA+ subjects (n = 6 per group) that did not develop RA (No RA within12 months) or developed RA within the following year (RA within 12 months). Each symbol (a–d) represents an individual donor; small horizontal lines indicate the mean (± s.e.m.). *P < 0.05, **P < 0.01 and ***P < 0.001 (P ≤ 0.0001 in a) (Student’s t-test (a,c–e) or ordinary one-way ANOVA (b)). Data are representative of one experiment per donor (a,b,e; error bars (e), s.e.m.) or three experiments (c,d).

