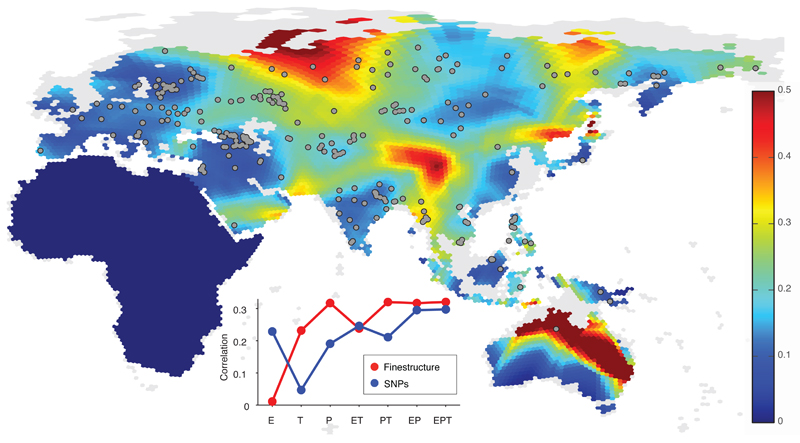
Figure 1. Genetic barriers across space.
Spatial visualisation of genetic barriers inferred from genome-wide genetic distances, quantified as the magnitude of the gradient of spatially interpolated allele frequencies (value denoted by colour bar; grey areas have been land during the last glacial maximum but are currently under water). Here we used a spatial kernel smoothing method based on the matrix of pairwise average heterozygosity a matlab script that plots the hexagons of the grid with a colour coding to represent gradients Inset: partial correlation between magnitude of genetic gradients and combinations of different geographic factors, elevation (E), temperature (T) and precipitation (P), for genetic gradients from fineSTRUCTURE (red) and allele frequencies (blue). This analysis (SI1:2.2.2 for details) shows that genetic differences within this region display some correlation with physical barriers such as mountain ranges, deserts, forests, and open water (such as the Wallace line).

