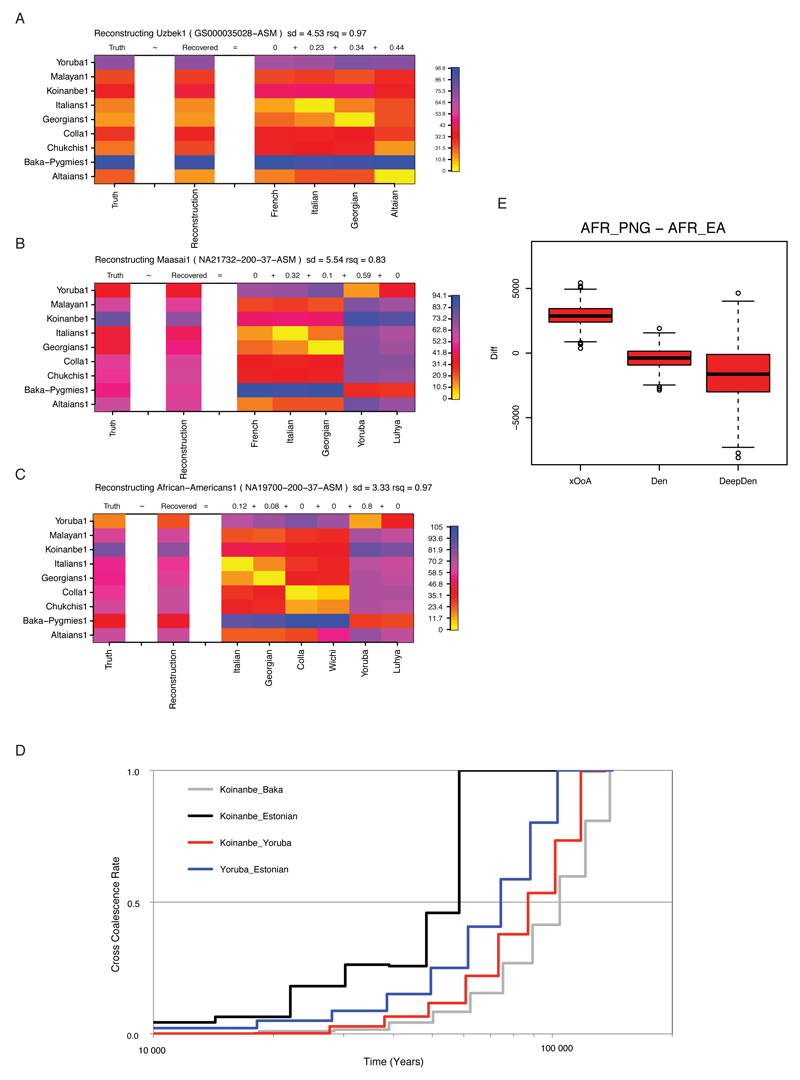
ED8. MSMC Linear behavior of MSMC split estimates in presence of admixture.
The examined Central Asian (A), East African (B), and African-American (C) genomes yielded a signature of MSMC split time (Truth, left-most column) that could be recapitulated (Reconstruction, second left most column) as a linear mixture of other MSMC split times. The admixture proportions inferred by our method (top of each admixture component column) were remarkably similar to the ones previously reported from the literature.
MSMC split times (D) calculated after re-phasing an Estonian and a Papuan (Koinanbe) genome together with all the available West African and Pygmy genomes from our dataset to minimize putative phasing artefacts. The cross coalescence rate curves reported here are quantitatively comparable with the ones of Figure 2 A, hence showing that phasing artefacts are unlikely to explain the observed past-ward shift of the Papuan-African split time. Boxplot (E) showing the distribution of differences between African-Papuan and African-Eurasian split times obtained from coalescent simulations assembled through random replacement to make 2000 sets of 6 individuals (to match the 6 Papuans available from our empirical dataset), each made of 1.5 Gb of sequence. The simulation command line used to generate each chromosome made of 5Mb was as follows, being *DIV*=0.064; 0.4 or 0.8 for the xOoA, Denisova (Den) and Divergent Denisova (DeepDen) cases, respectively: ms0ancient2 10 1 .065 .05 -t 5000. -r 3000. 5000000 -I 7 1 1 1 1 2 2 2 -en 0. 1 .2 -en 0. 2 .2 -en 0. 3 .2 -en 0. 4 .2 -es .025 7 .96 -en .025 8 .2 -ej .03 7 6 -ej .04 6 5 -ej .060 8 3 -ej .061 4 3 -ej .062 2 1 -ej .063 3 1 -ej *DIV* 1 5

