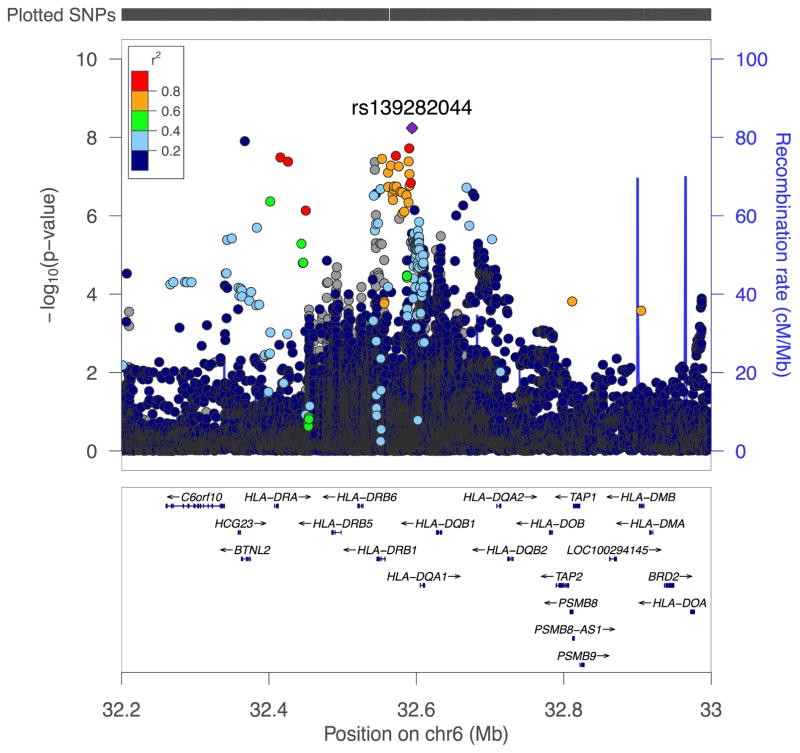
Figure 3.
LocusZoom plots of SNPs by chromosome position against –log10 p-value for their genetic associations with IBD phenotype. Conditional regional plot for the HLA locus (chr6p21) for the IBD phenotype shows SNPs reaching genome-wide significance conditioned on SNP rs9270299 from UC analysis. The top SNP is highlighted in purple. The surrounding SNPs, shown within 500kb of the top SNP are color-coded to reflect their linkage disequilibrium in r2 with the top SNP (see inset). Estimated recombination rates are plotted in pale blue to reflect local LD structure on secondary y-axis.

