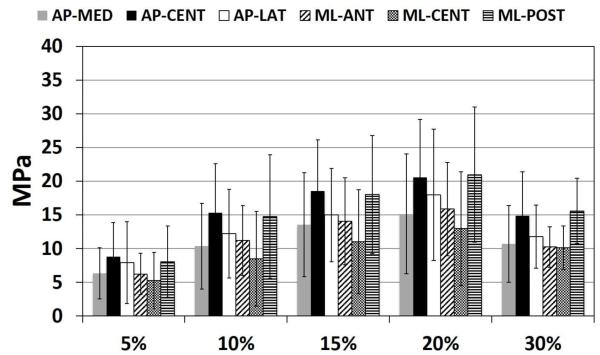
Figure 4.
Young’s Modulus at each strain increment (5%, 10%, 15%, 20% and 30%), for each region in the AP direction (AP-MED, AP-CENT, AP-LAT) and ML direction (ML-ANT, ML-CENT, ML-POST). Young’s Modulus increased with increasing strain increment from 5% to 20% strain, before decreasing at 30% strain. All pairwise comparisons between strain increments were significant, except for between 15-20% and 10-30% strain which were not statistically different: 5% vs 10%, p<0.001; 5% vs 15%, p<0.001; 5% vs 20%, p<0.001; 5% vs 30%, p<0.001; 10% vs 15%, p<0.001; 10% vs 20%, p<0.001; 10% vs 30%, p=0.985; 15% vs 20%, p=0.087; 15% vs 30%, p=0.039; 20% vs 30%, p<0.001.

