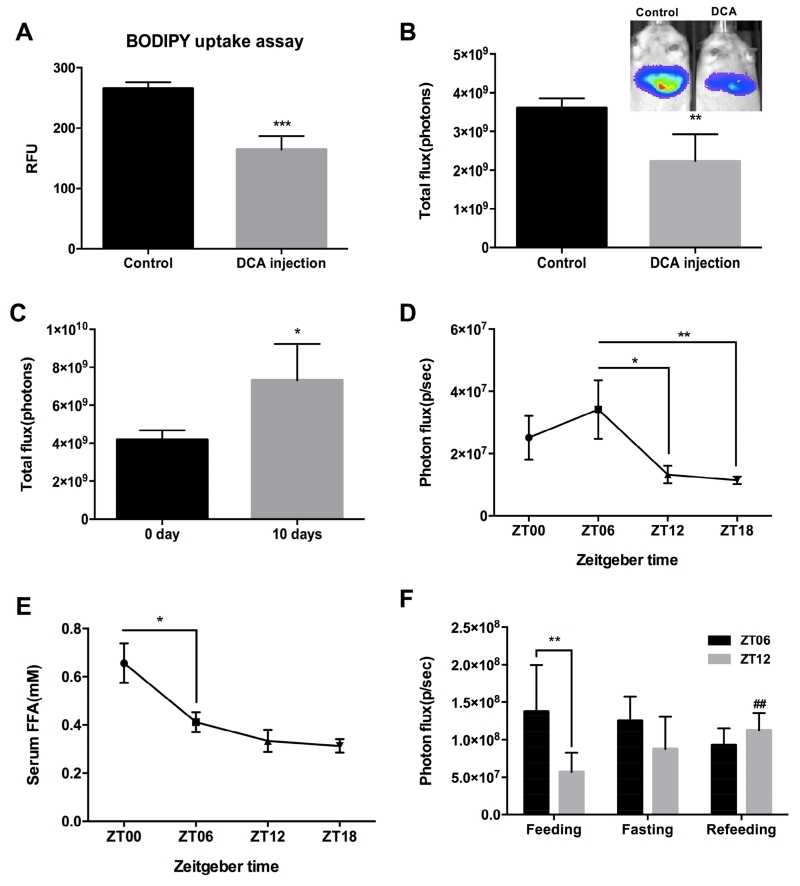
Figure 2. Application of bioluminescence imaging (BLI) to monitoring the changes in FFA hepatic uptake in different physiological conditions.
Acute effects of DCA injection at the concentration of 6.4 mg/kg body weight into L-Luc mice on the reduction of hepatic uptake of BODIPY(A) and FFA-Luc (B). **P < 0.01, ***P < 0.001 (n = 5) in Student’s t-test. (C) Fenofibrate feeding increased FFA-Luc uptake in the liver. **P < 0.01 (n = 5) in Student’s t-test. (D) FFA uptake rate after the injection of FFA-Luc into L-Luc mice and serum FFA concentration (E) during the light (ZT6, ZT12) and dark (ZT18, ZT0) periods. *P < 0.05, **P<0.01 (n = 5) in one-way ANOVA. (F) FFA uptake rate after regular feeding, 24hr of fasting and refeeding during the light (ZT6, ZT12) periods. ##P<0.01 between feeding and refeeding at ZT12, **P<0.01 in a paired Student’s t-test. Values are reported with error bars as ±SEM.

