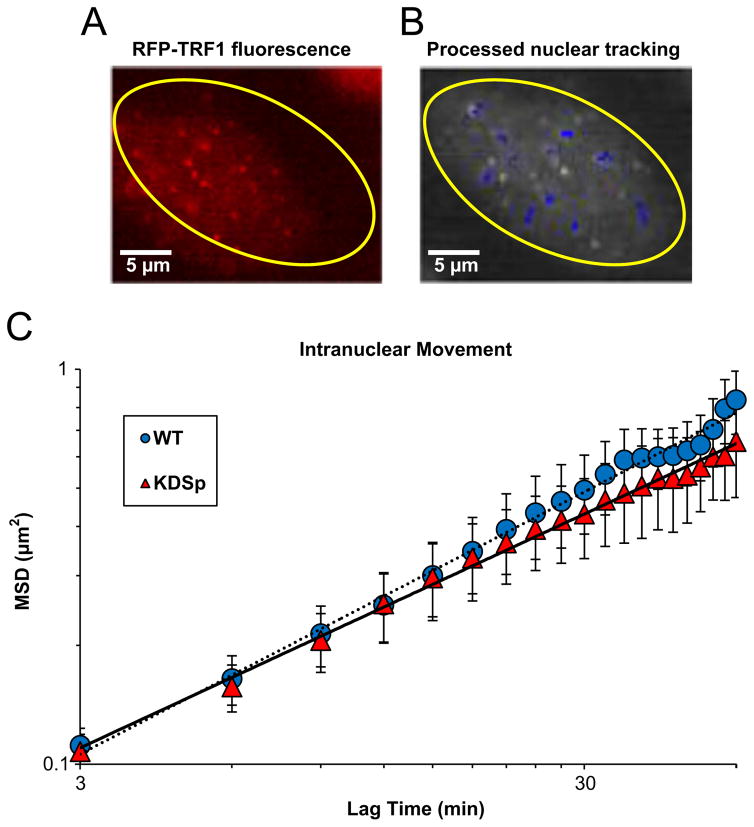
Fig. 3.
Intranuclear particle tracking analysis. (A) Shows an example of a cell nucleus (yellow outline) expressing RFP-TRF1. This telomeric protein appears as punctate fluorescent speckles in the nucleus which are tracked at 3-minute time intervals for 1 hour. (B) Shows tracks (blue overlay) of these chromatin-bound proteins demonstrate Brownian motion. (C) Shows a plot of mean squared displacement (MSD) vs. lag time for αII-spectrin knock-down cells compared to wild type (non-treated) cells. Interestingly, no significant difference is seen in MSD between groups for any lag time, indicating no changes in intranuclear movement when spectrin levels are decreased. n=12 WT cells, with 37 total points tracked and n=17 KDSp cells, with 65 total points tracked.(For interpretation of the references to color in this figure legend, the reader is referred to the web version of this article).

