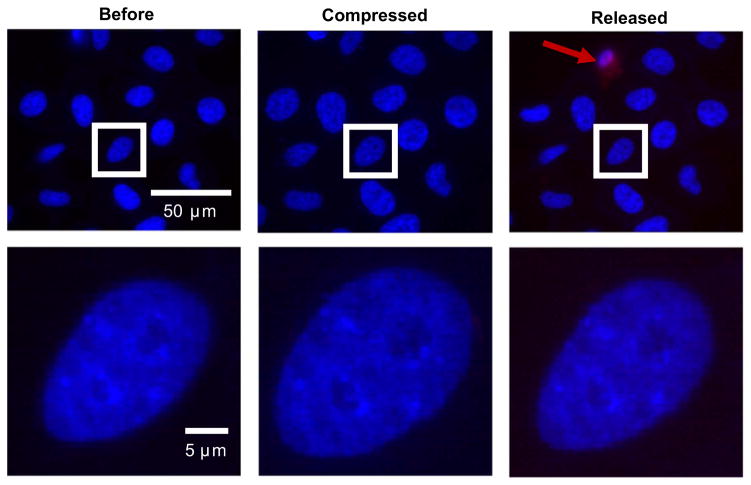
Fig. 4.
Example of nuclear area increase, and subsequent decrease in wild type control cells after compression, and release of compression. Nuclei are stained with Hoechst. Propidium iodide (PI) was added to media for compression assays to assure cell membrane remained intact for the entire experiment. In the release frame, a PI stain is seen in one cell, indicated by a red arrow. This cell would not be used for analysis. (For interpretation of the references to color in this figure legend, the reader is referred to the web version of this article).

