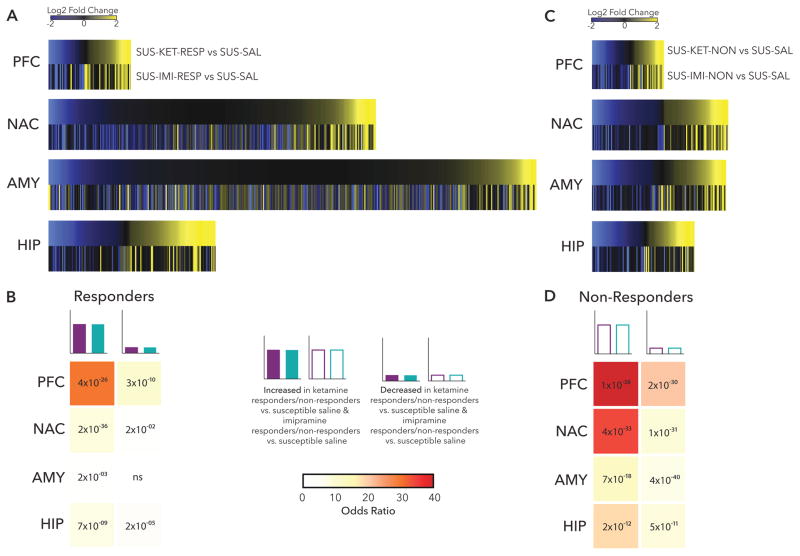
Figure 2. Characterization of Treatment Response & Non-Response.
(a) Heatmaps show the union of ketamine response (SUS-KET-RESP vs. SUS-SAL) and imipramine response (SUS-IMI-RESP vs. SUS-SAL) DEGs rank ordered by log2 fold changes of ketamine response and scaled by relative number of DEGs. (b) Table of p-value (text) and odds ratio (warmer colors indicating increasing odds ratio) for Fisher’s exact test for enrichment of ketamine response DEGs in imipramine response DEGs. (c) Heatmaps show the union of ketamine non-response (SUS-KET-NON vs. SUS-SAL) and imipramine non-response (SUS-IMI-NON vs. SUS-SAL) DEGs rank ordered by log2 fold changes of ketamine non-response and scaled by relative number of DEGs. (d) Table of p-value (text) and odds ratio (warmer colors indicating increasing odds ratio) for Fisher’s exact test for enrichment of ketamine non-response DEGs in imipramine non-response DEGs. *p<0.05

