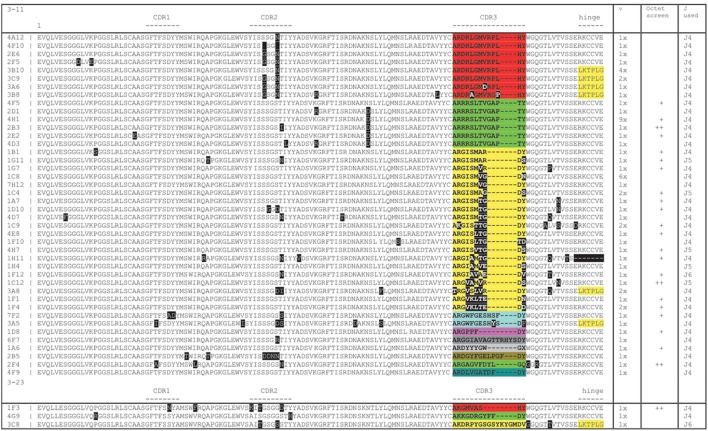
Figure 3.
Sequence analysis of hemagglutinin X-31 ELISA positive clones showing a broad range of diversity based on somatic mutations (black boxes) and CDR3 loops (blocks of different colors). The columns on the right show the number of times a particular sequence was found, whether it tested positively on Octet and which J region was used. Yellow shading at the carboxy-terminal end of the sequence shows an IgG3 sequence (LKTPLG), the others are IgG2 (RKCCVE).

