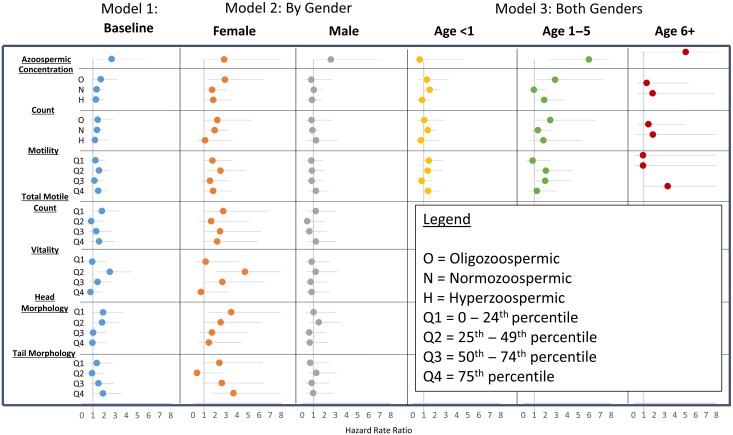
Figure 3.
Hazard Rate Ratios and 95% CI for the risk of congenital malformation-related mortality in siblings of subfertile men by semen quality category relative to siblings of fertile controls. Model 1 shows the baseline results for males and females combined. Model 2 shows the gender specific estimates. Model 3 shows the non-proportional effects for males and females combined by age group. Model 3 results for total motile count, vitality, head morphology, and tail morphology are not shown because these measures are only available for a subset of the sample and cell counts become too small when parsed by semen quality and three categories of age. Azoospermia was included as a separate category in each model. The results are stable across models because they constitute the same group of men, therefore only the azoospermic models from the concentration model are displayed in the figure.

