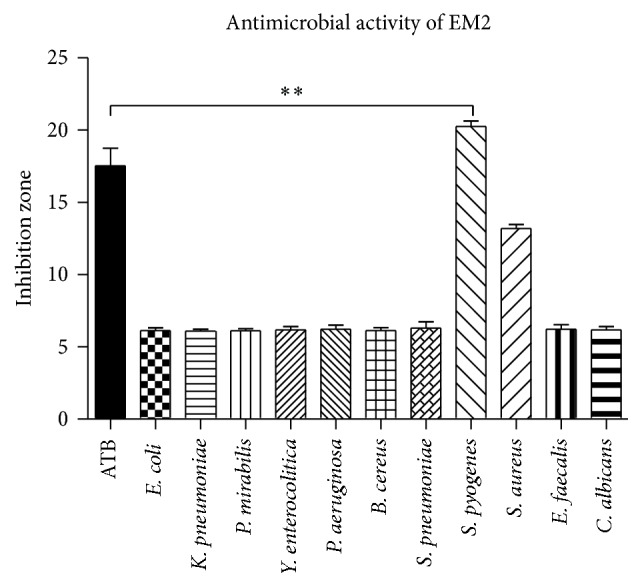
Figure 3.

Zones of inhibition (mm) by EM2 for the mentioned bacterial strains and fungus. Data are presented as means ± SD. The experiments were carried out in duplicate (P < 0.01 versus the effects of antibiotics). ∗∗ indicate P < 0.01 as compared with the control group.
