
Figure 1.
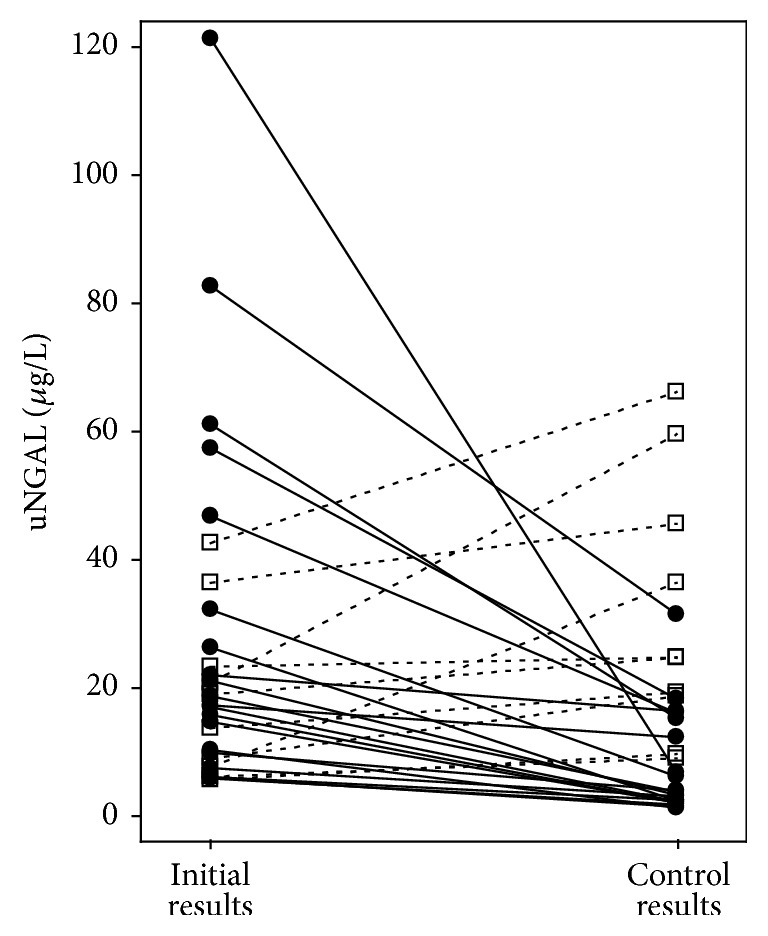
Urinary NGAL concentrations at the beginning of the study (initial results) and after 1 year of nephroprotective treatment (control results) among 30 DKD patients with available follow-up data. Closed circles and solid lines represent patients with decreasing uNGAL; open squares and dashed lines represent patients with increasing uNGAL. For abbreviations, see Table 1.