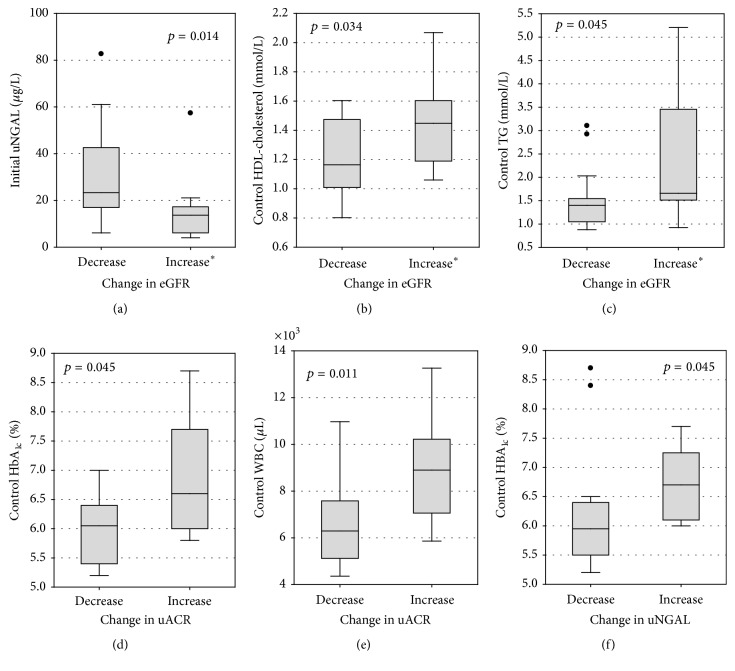
Figure 2.
Statistically significant differences in laboratory test results between patients with different direction of change in the studied markers of kidney function. The change in the marker of kidney function was defined as the difference between the control value (after 12 months of treatment) and the initial value (at the beginning of the study). ∗Increase or no change in eGFR. TG, triglycerides; see Tables 1 and 3.

