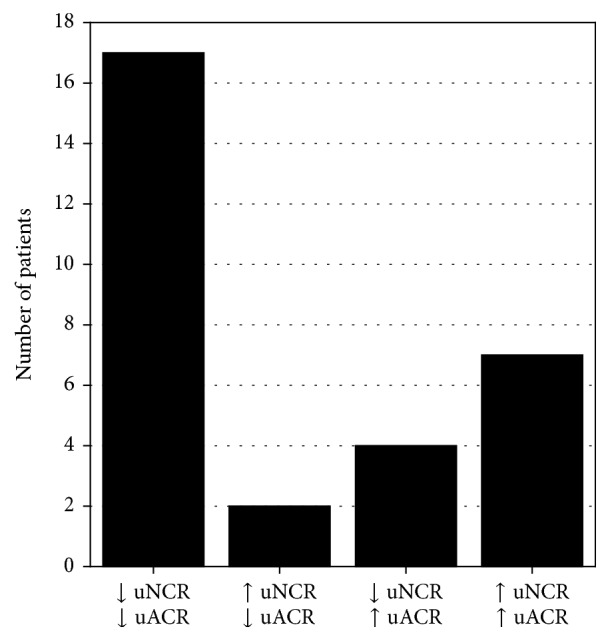
Figure 3.

Numbers of patients in whom either a decrease or an increase in the values of uNCR and uACR was observed after 12 months of treatment in comparison with initial values. ↓: decrease in the value of a given marker as assessed after 12 months of the study; ↑: increase in the value of a given marker as assessed after 12 months of the study; For abbreviations, see Table 1.
