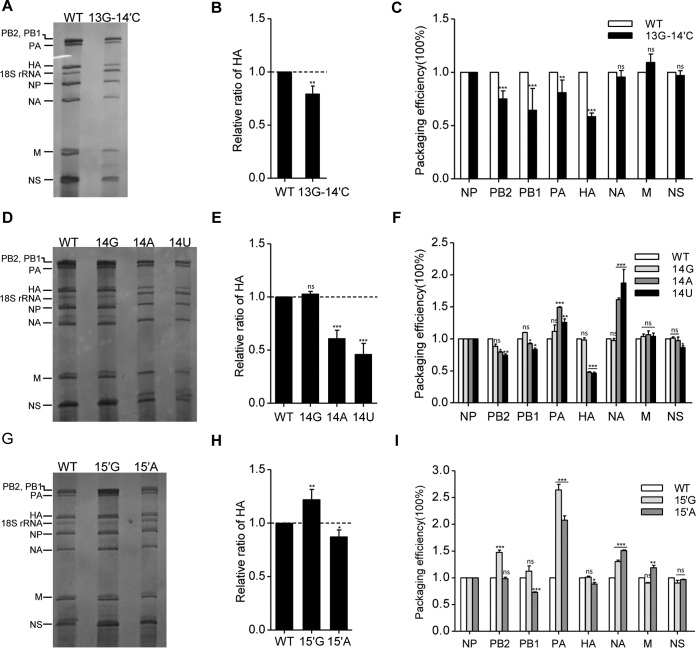
FIG 5.
Effects of nucleotide substitutions at 3′-end positions 13 and 14 and 5′-end positions 14′ and 15′ on virus genome packaging. (A, D, and G) Analysis of the packaging efficiency of each individual vRNA with silver staining gel. Wild-type and mutant viruses [WSN-HA(13G-14′C), WSN-HA(14G), WSN-HA(14A), WSN-HA(14U), WSN-HA(15′G), and WSN-HA(15′A)] were amplified on MDCK cells and purified by ultracentrifugation through a 30% sucrose cushion. Then, the virion vRNAs were extracted with TRIzol reagent, analyzed on a 2.8% denaturing polyacrylamide gel, and visualized by silver staining. (B, E, and H) Statistical analysis of the HA vRNA packaging efficiencies from the experiments shown in panels A, D, and G by densitometry analysis. The band intensities were quantified using ImageJ software. The HA/NP vRNA ratio in the WT virus was set as 1. The relative HA/NP vRNA ratios in mutant viruses were calculated (means and standard deviations of three independent experiments). (C, F, and I) Statistical analysis of packaging efficiency of each individual vRNA by RT-qPCR. The data represent means ± standard deviations of three independent experiments. The relative ratio of each vRNA segment to NP vRNA was calculated. The standard deviations were derived from three independent virus preparations, with vRNA levels quantified in duplicate. *, P < 0.05; **, P < 0.01; ***, P < 0.001; ns, nonsignificant.

