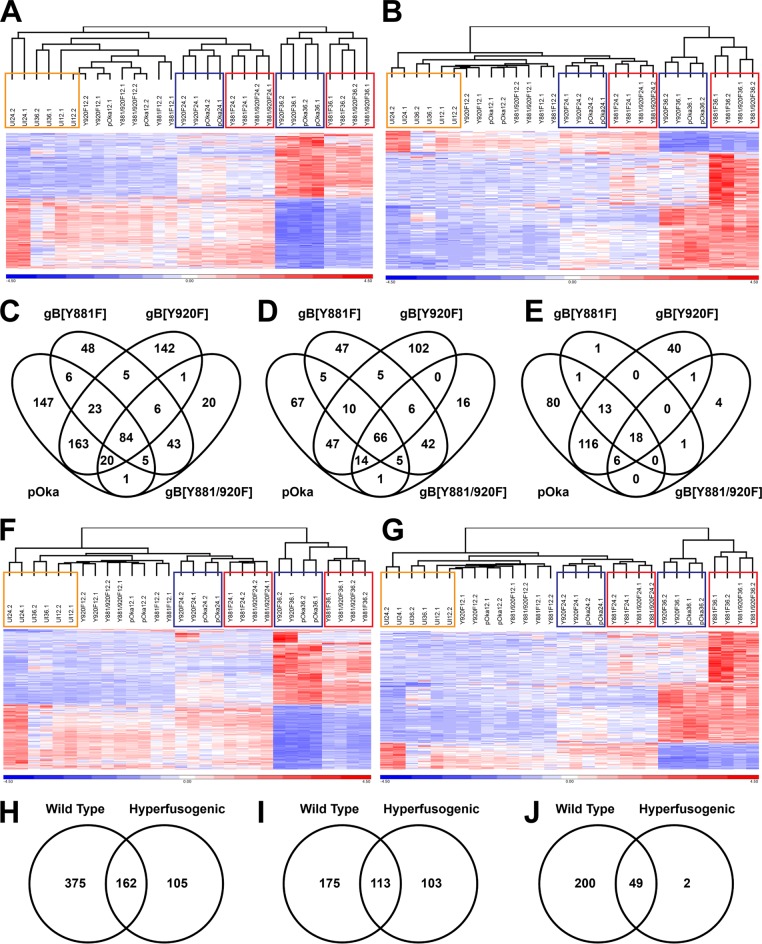
FIG 8.
Dysregulated gBcyt-mediated cell fusion affects the host transcriptional response to VZV infection. (A, B, F, and G) Hierarchical clustering of the RPKM gene expression values for the entire RNA-seq data set by using either the 449 genes for pOka (A), the 220 genes for gB[Y881F] (B), the 537 genes associated with wild-type-like (F), or the 267 genes associated with hyperfusion (G) that were differentially expressed in melanoma cells at 36 hpi. Gene expression data have been normalized by reallocating gene RPKM values to a mean of zero, scaled to a standard deviation of one, and expressed as a heat map with a range from −4.5 (blue) to +4.5 (red). The dendrograms above the heat maps show the grouping of RNA-seq samples. The colored boxes highlight the groupings of uninfected cells (orange) at 12 to 36 hpi and the wild-type phenotype (blue) and the hyperfusion phenotype (red) at 24 and 36 hpi. (C to E and H to J) Venn diagrams show the frequencies of differentially expressed genes (C and H), upregulated genes (D and I), and downregulated genes (E and J) associated with pOka and the three gBcyt mutant viruses (C to E) or VZV phenotype (H to J) in melanoma cells at 36 hpi.

