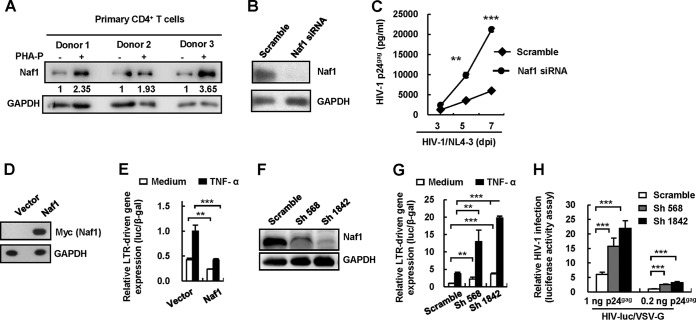
FIG 1.
Naf1 suppresses HIV-1 LTR-driven gene expression and viral replication. (A) Endogenous expression of Naf1 in primary CD4+ T cells as detected by immunoblotting. The densities of bands were analyzed with the plug-ins of ImageJ software, and the values relative to that for GAPDH were calculated. (B and C) Naf1 knockdown increases HIV-1 replication. Phytohemagglutinin P (PHA-P)-activated primary CD4+ T cells were transfected with Naf1-specific siRNA or an off-target control, and then cells were infected with replication-competent HIV-1NL4-3. The levels of HIV-1 p24gag in the supernatants were quantified by ELISA. Results are representative of three independent repeats. dpi, days postinfection. (D and E) Naf1 overexpression inhibits HIV-1 LTR-driven gene expression. The myc-tagged plasmid pCMV-Tag 3B/Naf1 or vector and an HIV-1NL4-3 LTR promoter-driven luciferase reporter plasmid were cotransfected into HEK293T cells, and a β-Gal-expressing vector was used to normalize transfection efficiency. At 24 h posttransfection, cells were treated with or without TNF-α for an additional 24 h, and then cells were harvested and reporter gene expression assessed. Results are representative of five independent repeats. (F and G) Naf1 knockdown significantly increases TNF-α-induced LTR-driven gene expression. The endogenous Naf1 in HEK293T cells was knocked down by use of Naf1-specific shRNA. Cells were transfected with an HIV-1NL4-3 LTR promoter-driven luciferase reporter plasmid, and reporter gene expression was detected as described above. (H) Naf1 knockdown promotes HIV-1 infection. The endogenous Naf1 in HEK293T cells was knocked down by use of Naf1-specific shRNA, cells (1 × 10⁵) were infected with pseudotyped HIV-luc/VSV-G for 24 h (using amounts of virus equivalent to 0.2 or 1 ng p24gag), and viral infections were quantified by detection of luciferase activity. Results in panels G and H are representative of four independent experiments. Data are presented as means ± standard deviations (SD). **, P < 0.01; ***, P < 0.001 (unpaired t test).

