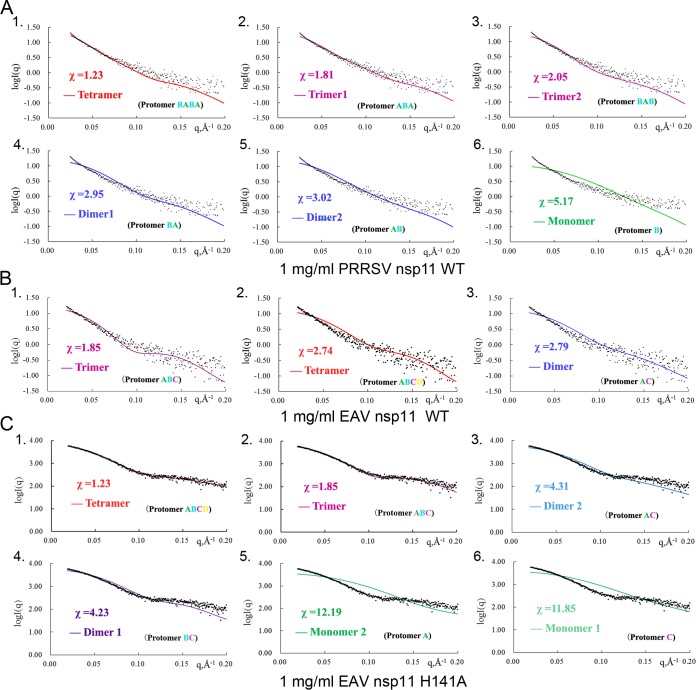
FIG 6.
Comparison of SAXS experimental data and calculated scattering profiles for nsp11 at a 1-mg/ml concentration. Experimental data are represented by black dots. The theoretical scattering curves of tetramers, trimers, dimers, and monomers are shown. (A) WT PRRSV nsp11; (B) WT EAV nsp11; (C) EAV nsp11 H141A mutant.

