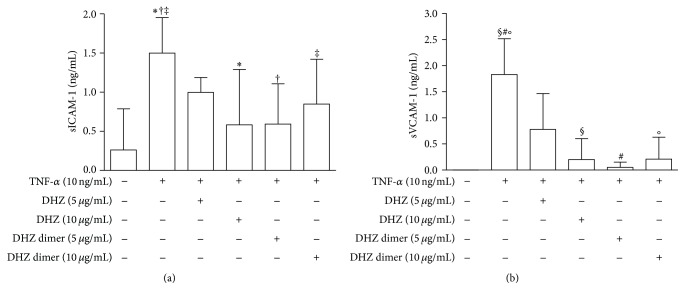
Figure 5.
ICAM-1 and VCAM-1 secretion. Analysis of soluble ICAM-1 (a) and VCAM-1 (b) concentrations (ng/mL) by ELISA assay performed in culture supernatants from HUVEC pretreated with DHZ or DHZ dimer and then treated with TNF-α 10 ng/mL for 6 hours (mean values of four experiments). Error bars represent SD. (a) ∗, † p = 0.0317; ‡ p = 0.0236. Medium versus TNF-α, p < 0.01. (b) §, #, ° p = 0.0079. Medium versus TNF-α p < 0.001.

