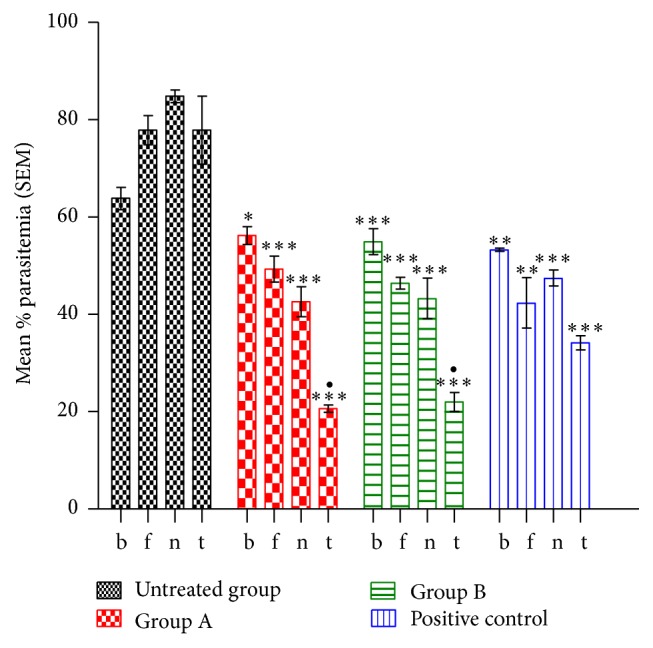
Figure 2.

Percentage of parasitemia in P. berghei infected mice with decrease in parasitemia in the treated groups. ∗∗∗Significant difference when compared to the negative control group; •significant difference when compared to the positive control group. Keys: B: before treatment. F: fourth day of treatment. N: eighth day of treatment. T: twelfth day of treatment. ∗means values are significantly different at p < 0.05 when compared with the positive control group. ∗∗means values are significantly different at p < 0.05 when compared with the untreated group.
