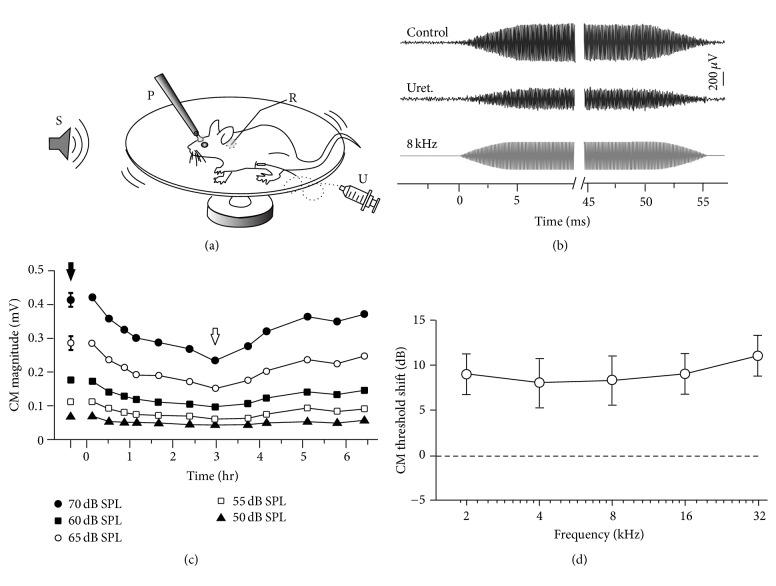
Figure 1.
Reduction in the CM after urethane anesthesia. (a) A schematic of our CM recording setup. S, sound stimulation delivered by a speaker; P, metal post for head fixation; R, silver wire recording electrode; U, urethane delivery. The rat was awake and allowed to run freely on a rotatable plate. (b) Examples of the CM measured in response to an 8 kHz, 70 dB SPL tone burst (sound waveform shown in the bottom panel). The magnitude before urethane injection (upper panel, filled arrow in (c)) compared to that after anesthesia (middle panel, open arrow in (c)). (c) The time course of the CM magnitude changes after urethane injection. The curves shown are CM responses to different sound levels. Three CM measurements evoked before urethane injection were averaged as a control (mean ± SD) for each sound level. Time 0 indicates the time point of urethane injection. (d) CM threshold shifts for urethane application. Data presented as mean ± SD. Note the CM thresholds were elevated at all frequencies examined (p < 0.05, Student's t-test, n = 5).

