
Figure 5.
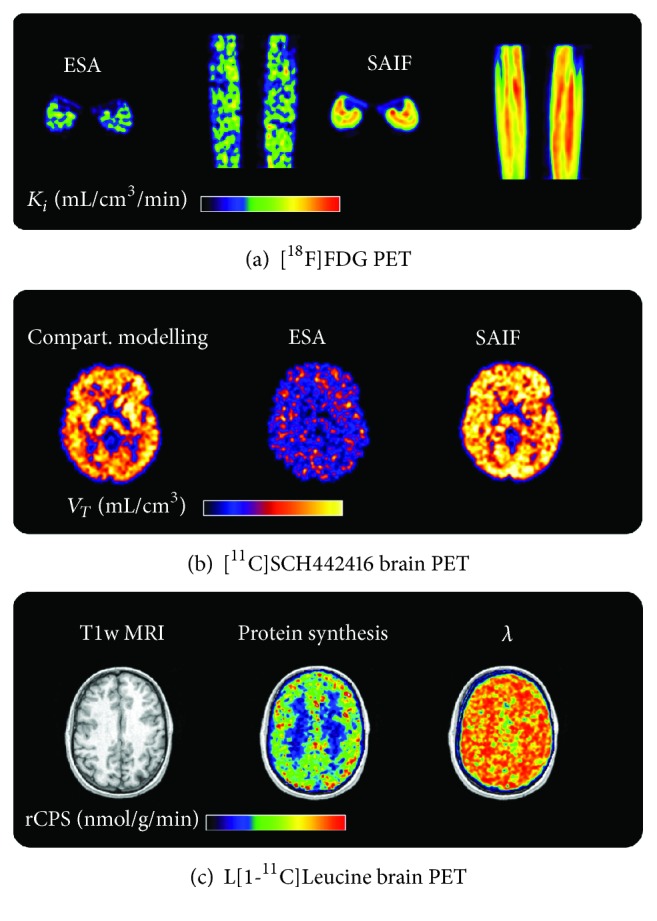
Parametric imaging with SA. (a) K i parametric maps obtained with ESA and SAIF applied to [18F]FDG PET data. Results refer to the midcalf area in one representative subject, reported in both axial and coronal views. (b) V T parametric maps obtained with ESA and a modified version of SAIF applied to [11C]SCH442416 brain PET data. Results refer to a representative transaxial slice of a healthy volunteer. V T map obtained from compartmental quantification is also reported for comparative purposes. (c) Rate of cerebral protein synthesis (rCPS) parametric map obtained with SAIF applied to L[1-11C]Leucine brain PET data. Results refer to a representative transaxial slice of a healthy volunteer. T1-weighted structural MRI and the fraction of blood-derived leucine (λ) are also reported for comparative purposes.