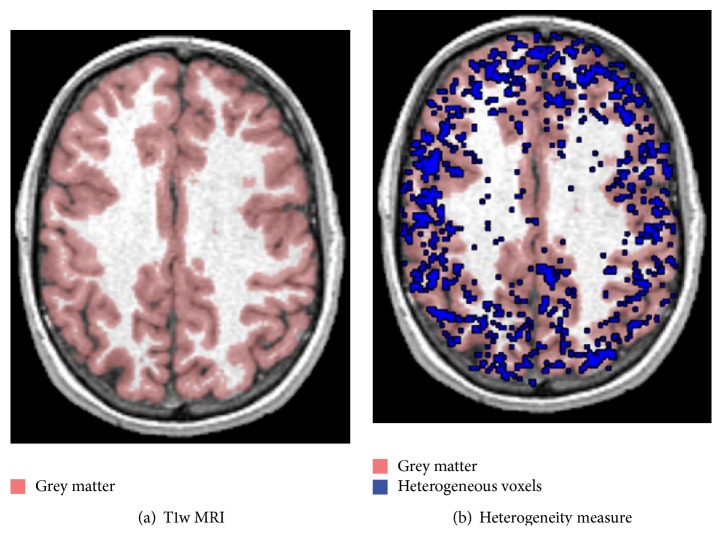
Figure 7.
Kinetic inhomogeneity analysis in L-[1-11C]Leucine. The figure shows T1-weighted MRI image (a) and the same anatomical picture fused with the spatial distribution of voxels estimated as heterogeneous (b). The blue points correspond to those voxels where SAIF algorithm detects the presence of at least two equilibrating components from the voxel time-activity curves analysis. The red area, instead, highlights the grey matter tissue as well as its border with white matter.

