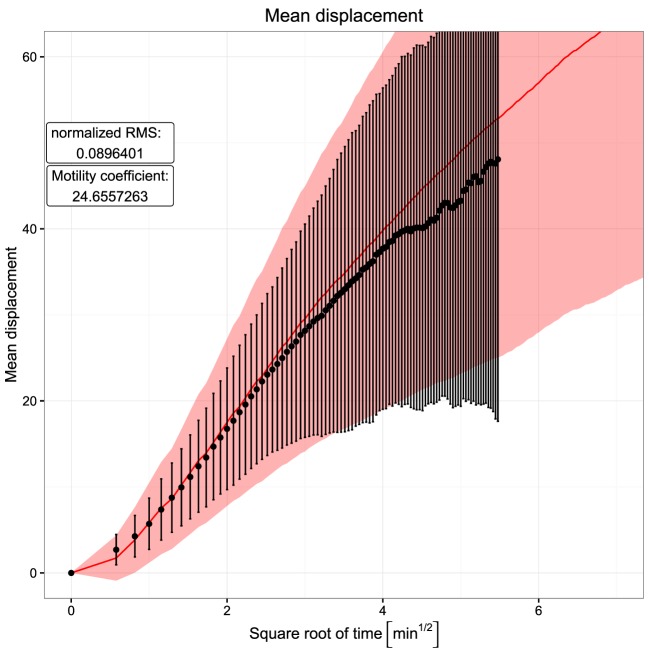
Figure 2.
Mean displacement versus square root of time. Dots and error bars indicate the mean displacement and SD of tracked cells as measured in experiment (6). The red line and shaded area show mean displacement and SD of tracked cells in 20 simulations. The cell position is tracked every 20 s both in silico and in experiment.

