Figure 5.

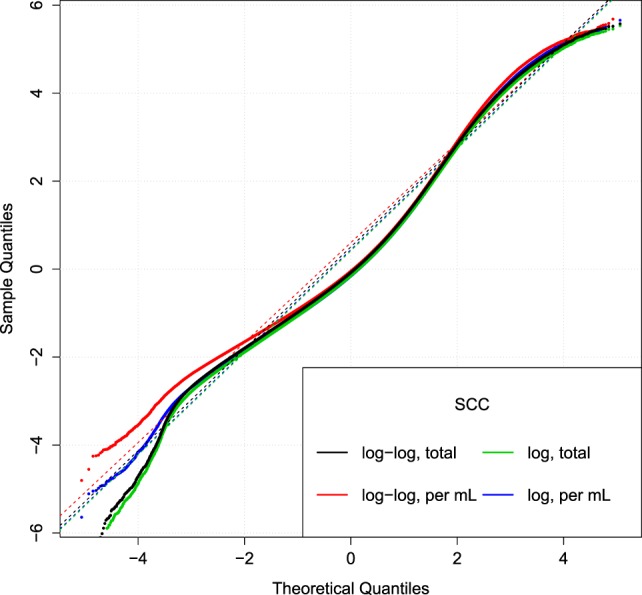
Comparison of SCC models. Q–Q plot of the relative residuals after using two different transformations (log or log–log) combined with the total (tSCC) or per ml SCC (uSCC) [equation (9)]. Broken lines are Q–Q lines using the 95% range.

Comparison of SCC models. Q–Q plot of the relative residuals after using two different transformations (log or log–log) combined with the total (tSCC) or per ml SCC (uSCC) [equation (9)]. Broken lines are Q–Q lines using the 95% range.